
We will discuss the following aspects. Please scroll down and start reading.
- Introduction
- Oxygen Saturation
- Physical properties used in pulse oximetry
- Calibration
- Pulse oximeters measure pulsatile arterial blood
- Signal is very small
- Plethysmographic trace (pleth)
- Light source
- Coping with ambient light
- Problems associated with using pulse oximeters.

A common desire of everyone is to be happy, but this is often not easy. The free website at the link below explains practical ways of achieving happiness in our modern crazy world. In particular, it focuses on how one can find happiness by changing how one thinks. The website is completely free so everyone can benefit from it.

Introduction
Pulse oximeters measure how much of the hemoglobin in blood is carrying oxygen (oxygen saturation).
If you work in healthcare (or have been patient !) you are very likely to have come across pulse oximeters. You can find them in areas such as operating rooms, recovery, critical care, wards, and ambulances.
Pulse oximeters are in common use because they are:
- non invasive
- cheap to buy and use
- can be very compact
- detects hypoxaemia earlier than you using your eyes to see cyanosis.
Oxygen Saturation
Pulse oximeters measure oxygen saturation. Before we learn the principles of how pulse oximeters work, we need to have an understanding of what oxygen saturation is.
We all know that we need oxygen for life. ( Some of you may find this section a little too basic. In that case, to skip this short section, click this link to go to next section Physical properties used in pulse oximetry )

Oxygen enters the lungs and then is passed on into blood. The blood carries the oxygen to the various organs in our body. The main way oxygen is carried in our blood is by means of hemoglobin. You can imagine hemoglobin molecules( Hb) as “cars” and the “roads” being our blood vessels. The oxygen molecules get into these cars and travel around the body till they reach their destination.

Let us consider these ” hemoglobin cars”.
The hemoglobin without oxygen we will call de oxygenated hemoglobin (deoxy Hb). The hemoglobin with oxygen, we will call oxygenated hemoglobin (oxy Hb).
Oxygen saturation simply refers to the percentage of the available hemoglobin that carries oxygen. Take the situations below. There are 16 hemoglobin units and none of the 16 have oxygen. The oxygen saturation is therefore 0 %.

Here, 8 of the 16 Hb have oxygen. The oxygen saturation is therefore 50 %.
Similarly for 75 % …
And of course , when all the Hb have oxygen, the saturation is 100 %
So in summary, oxygen saturation tells you the percentage of the total hemoglobin that is carrying oxygen.
Physical properties used in pulse oximetry
Pulse oximetry uses light to work out oxygen saturation. Light is emitted from light sources which goes across the pulse oximeter probe and reaches the light detector.
If a finger is placed in between the light source and the light detector, the light will now have to pass through the finger to reach the detector. Part of the light will be absorbed by the finger and the part not absorbed reaches the light detector.
The amount of light that is absorbed by the finger depends on many physical properties and these properties are used by the pulse oximeter to calculate the oxygen saturation.
The amount of light absorbed depends on the following:
1. concentration of the light absorbing substance.
2. length of the light path in the absorbing substance
3. oxyhemoglobin and deoxyhemoglobin absorbs red and infrared light differently
Don’t worry ! All the above will be explained in the next sections:
The physical properties that a pulse oximeter employs will be explained using the probe shown below. A finger is shown inserted into the probe. Above the finger are the light sources that emit light. In the finger is an artery which carries the blood the pulse oximeter is interested in and a vein through which the blood leaves the finger. Below the finger is the light detector.
Physical property No.1 : Amount of light absorbed is proportional to the concentration of the light absorbing substance
Hemoglobin (Hb) absorbs light. The amount of light absorbed is proportional to the concentration of Hb in the blood vessel. In the diagram below, the blood vessels in both fingers have the same diameter. However, one blood vessel has a low Hb concentration ( i.e. low number of Hb in each unit volume of blood) and the other blood vessel has a high Hb concentration ( i.e. high number of Hb in each unit volume of blood). Each single Hb absorbs some of the light, so more the Hb per unit area, more is the light is absorbed. This property is described in a law in physics called “Beer’s Law”.
Beer’s Law: Amount of light absorbed is proportional to the concentration of the light absorbing substance
By measuring how much light reaches the light detector, the pulse oximeter knows how much light has been absorbed. More the Hb in the finger , more is the light absorbed.
Physical property No.2 : Amount of light absorbed is proportional to the length of the light path.
Look at the two fingers shown below. Both arteries have the same concentration (same Hb per unit area, blue square) However, the artery on right is wider than the one on the left.

The light emitted from the source has to travel through the artery. The light travels in a shorter path in the narrow artery and travels through a longer path in the wider artery ( paths are shown as green lines below). Though the concentration of Hb is the same in both arteries, the light meets more Hb in the wider artery, since it travels in a longer path. Therefore, longer the path the light has to travel, more is the light absorbed. This property is described in a law in physics called “Lambert’s Law”.
Lambert’s Law: Amount of light absorbed is proportional to the length of the path that the light has to travel in the absorbing substance.
Physical property No.3 : oxyhemoglobin absorbs more infrared light than red light & deoxyhemoglobin absorbs more red light than infrared light (this is explained below !)
We have seen how concentration and light path affect the absorbance of light. In addition to these, the pulse oximeter makes use of another important property to calculate oxygen saturation. That is, oxy hemoglobin and deoxy hemoglobin absorb light of different wavelengths in a specific way.
Before we go further, we need to remember what wavelength is. All light is composed of waves. The distance between the “tips” of the waves is equal to the wavelength.
Light wavelengths are very short, and the unit of measurement is nanometer (nm) ( 1 meter = 1,000,000,000 nanometers !). For an example, the wave on the left has a wavelength of 650 nm and the wave on the right has a longer wavelength of 950 nm.
Different “colors” of light have their own wavelength.
The pulse oximeter uses the property that oxyhemoglobin and deoxyhemoglobin absorb light of different wavelengths in a specific way. This property can be demonstrated in a laboratory as will be now described. We can first demonstrate how oxyhemoglobin absorbs light of different wavelengths in a specific way. We use a special light source of which we can adjust the wavelength of the light it emits. This light source sequentially passes light of different wavelengths through a sample of oxy Hb. The detector notes how much light, at each wavelength, has been absorbed.
A graph for the absorbance of oxy hemoglobin at different wavelengths will look like this. It shows that oxy Hb doesn’t absorb the same amount of light at different wavelengths.
We can repeat the same demonstration using deoxy Hb.
Again notice , how like oxy Hb, Deoxy Hb absorbs different amount of light at different wavelengths.
Now let us see the absorbance graph of oxy Hb and the absorbance graph of deoxy Hb together so you can compare them. Note how each of them absorbs light of different wavelengths very differently.
The pulse oximeter uses two lights to analyze hemoglobin.
One is a red light, which has a wavelength of approximately 650 nm. The other is an infrared light, which has a wavelength of 950 nm. (Throughout our description, we will show the infrared light in light blue. In reality, infrared light is invisible to the human eye.)
Now look at the oxy Hb absorbance graph again, but this time paying attention to the wavelengths of light used in pulse oximeters. You will see that oxy Hb absorbs more infrared light than red light.
Below is the graph that shows the absorbance of deoxy Hb. It is seen from the graph that deoxy Hb absorbs more Red light than Infrared light.
To make the comparison of absorbance of oxy Hb and deoxy Hb easier, here is a composite graph showing the absorbance of both. You will see that :
Oxy Hb absorbs more infrared light than red light
Deoxy Hb absorbs more red light than infrared light
You might find the memory aide below useful to remember the wavelengths absorbed by oxy Hb and deoxy Hb.
The pulse oximeter works out the oxygen saturation by comparing how much red light and infra red light is absorbed by the blood. Depending on the amounts of oxy Hb and deoxy Hb present, the ratio of the amount of red light absorbed compared to the amount of infrared light absorbed changes.
Using this ratio, the pulse oximeter can then work out the oxygen saturation.
For an example, at 100 % saturation, the absorbance ratio ( i.e. comparing how much red light and infrared light is absorbed) will be same as that seen with the oxy Hb absorbance curve that we saw earlier.
At 0 % saturation, there is only deoxy Hb. The absorbance ratio ( i.e. comparing how much red light and infrared light is absorbed) will therefore be same as that seen with the de oxy Hb absorbance curve that we saw earlier.
Now look at when the patient has an oxygen saturation of 75 %. The blood has both , oxy Hb and deoxy Hb. The absorbance pattern is now somewhere in between the oxy Hb curve and deoxy Hb curve (both shown in grey). The ratio of absorbed red light and infrared light is different and using this information, the pulse oximeter is able to calculate the oxygen saturation as 75 %.
At 50 % oxygen saturation, the absorbance pattern is different to when the saturation was 75 %. The ratio of red light and infrared light absorbed is also therefore different and the pulse oximeter uses this to calculate the saturation as 50 %.
At 25 % saturation, you and your patient is in deep trouble. Again the ratio is different.
The animation below shows what you have seen before. As the amount of oxy Hb and deoxy Hb changes, the light ratio comparing red and infrared light also changes. The pulse oximeter uses the ratio to work out the oxygen saturation.
To summarize things so far, the absorbance of light depends on:
1. concentration of the light absorbing substance.
2. length of the light path in the absorbing substance
3. oxyhemoglobin and deoxyhemoglobin absorbs red and infrared light differently
The pulse oximeter computer takes these things factors and computes the saturation.

Hello! My name is Pras and I am the author of this website that you are now reading. I have made this website completely free to access so that people from all over the world can benefit from it.
If you can afford it, I would be very grateful if you would consider making a single donation of one dollar (or the equivalent in your currency) to help cover the expenses needed to run this website (e.g. for special software and computers). For this website to survive, donations are desperately needed. Sadly, without donations, this website may have to be closed down.
Unfortunately, perhaps because many people think that someone else will donate, this website gets only very few donations. If you are able to, please consider making a single donation equivalent to one dollar. With support from people like you, I am sure that this educational website will continue to survive and grow.


Everyone wants to be happy. However, according to psychologists, many of us think in certain “unhelpful” ways which can prevent us from being happy. The free website at the link below describes the concept of “Happy Thinking”, which is about using simple methods to change such ways of thinking. You are welcome to visit it and find happiness by changing how you think. The website is completely free.

Calibration Adjustment
Early on , we discussed how the pulse oximeter uses Beer’s and Lambert’s Law ( absorbance depends on concentration and path length) as part of its factors that it uses to compute oxygen saturation. Unfortunately, there is a problem. In physics, the Beer and Lambert law have very strict criteria to be accurate. For an example, the light that goes through the sample should go straight through like the lights rays in the image below.
However, in real life , this does not happen. Blood is not a neat red liquid. Instead, it is full of various irregular objects such as red cells etc. This makes the light scatter, instead of going in a straight line. Therefore Beer and Lamberts Law cannot be applied strictly.
Because Beer and Lamberts law cannot be applied strictly, there would be errors if they were used to directly calculate oxygen saturation. A solution to this is to use a “calibration graph” to correct for errors. A test pulse oximeter is first calibrated using human volunteers. The test pulse oximeter is attached to the volunteer and then the volunteer is asked to breath lower and lower oxygen concentrations. At intervals, arterial blood samples are taken. As the volunteers blood desaturates, direct measurements made on the arterial blood are compared simultaneously with the readings shown by the test pulse oximeter.In this way, the errors due to the inability of applying Beers and Lamberts law strictly are noted and a correction calibration graph is made. However, in order to not harm the volunteers, the oxygen saturation is not allowed to drop below about 75 – 80 %.
A copy of this correction calibration graph is available inside the pulse oximeters in clinical use. When doing its calculations, the computer refers to the calibration graph and corrects the final reading displayed. As mentioned before, the volunteer studies described before do not allow the saturation to go below about 75 – 80 %. For saturations below this, the calibration curve is mathematically estimated .Therefore, pulse oximeters are typically less accurate below saturations of about 75 – 80 %.
Pulse oximeters measure pulsatile blood
In a body part such as a finger, arterial blood is not the only thing that absorbs light. Skin and other tissues also absorb some light. This poses a problem , because the pulse oximeter should only analyse arterial blood while ignoring the absorbance of light by surrounding tissues. For an example of how tissues can interfere, take the two situations shown below. One is a thin finger and the other is a fat finger. The tissues in the thin finger absorbs only a little extra light, while the fatter finger shown on the right absorbs much more light. However, the pulse oximeter has no way to measure if the finger is fat or thin, and therefore has the potential to get confused because it doesn’t know how much light is absorbed by blood and how much is absorbed by the tissues surrounding blood.
Fortunately, there is a clever solution to the problem. The pulse oximeter wants to only analyse arterial blood, ignoring the other tissues around the blood. Luckily, arterial blood is the only thing pulsating in the finger. Everything else is non pulsating. Any “changing absorbance” must therefore be due to arterial blood.
On the other hand, the pulse oximeter knows that any absorbance that is not changing , must be due to non pulsatile things such as skin and other “non arterial” tissues.
So the final signal picture reaching the pulse oximeter is a combination of the “changing absorbance” due to arterial blood and the “non changing absorbance” due to other tissues.
The pulse oximeter is able to use some clever mathematics to extract the “changing absorbance” signal from the total signal, as will be described. As shown below, the computer subtracts the non changing part of the absorbance signal from the total signal. After the subtraction, only the “changing absorbance signal” is left, and this corresponds to the pulsatile arterial blood. In this way, the pulse oximeter is able to calculate the oxygen saturation in arterial blood while ignoring the effects of the surrounding tissues.
The signal is really small !
The diagrams used so far have exaggerated the size of the pulsatile part to make it easy for you to see and understand.
However, in reality, the pulsatile signal is very small. Typically , only about 2 % of the total signal is pulsatile ! Drawn to scale, 2 % of the total signal will look like the diagram below. The orange part represents the “non changing” light absorbed by the tissues. The red shows the changing absorbance due to pulsatile arterial blood. See how small this pulsatile signal is. Off all the light that passes through the finger, it is only the small pulsatile part that the pulse oximeter analyses. Because it is such a small amount of the total light, the pulse oximeter is very susceptible to errors if for an example, the probe is not placed properly or if the patient moves the probe.

Plethysmographic trace (Pleth)
Pulse oximeters often show the pulsatile change in absorbance in a graphical form. This is called the “plethysmographic trace ” or more conveniently, as “pleth”.
The pleth is an extremely important graph to see. It tells you how good the pulsatile signal is. If the quality of the pulsatile signal is poor, then the calculation of the oxygen saturation may be wrong. The pulse oximeter uses very complicated calculations to work out oxygen saturation. A poor pleth tracing can easily fool the computer into wrongly calculating the oxygen saturation. As human beings, we like to believe what is good, so when we see a nice saturation like 99 % , we tend to believe it, when actually the patients actual saturation may be much lower. So always look at pleth first, before looking at oxygen saturation.
Never look only at oxygen saturation !

Just to remind you (okay , I promise, this is the last time!), think of “SpO2” as a reminder …..

The pleth is affected by factors that affect the peripheral blood flow. For an example, low blood pressure or peripheral cold temperature can reduce it.
Sophisticated uses of the pleth are being developed. For example, it may be used to guide fluid therapy. These discussions are beyond the scope of this web site.
Light source
Pulse oximeters use a type of light source called “light emitting diodes” (LED) which are extremely commonly used in electronics.
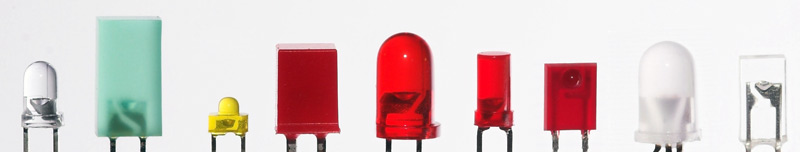
Light emitting diodes are ideal for pulse oximeters as they :
- Are cheap ( so can be used even in disposable probes)
- Are very compact (can fit into very small probes)
- Emit light in accurate wavelengths
- Do not heat up much during use (low temperature makes it less likely to cause patient burns)
Light Emitting Diodes come in a variety of types that emit light in specific wavelengths. Fortunately, there are light emitting diodes (LED) that emit light in the red light and infrared light wavelengths and these are thus conveniently used in pulse oximeters. The exact wavelengths of the LEDs used depends on the manufacturer. For convenience, in our discussions, we made the red LED to have a wavelength of 650 nm and the infrared LED to have a wavelength of 950 nm (easy to remember). However, most text books will quote 660 nm and 940 nm.
Accounting for ambient (room) light
The pulse oximeter probe, as shown below, has a red LED and one infrared LED. On the other side, is a light detector. However, you will note that, though there are only two LEDs, the light detector is exposed to three sources of light. In addition to the red and infra red LED light sources, there is also light in the room (ambient light) that the pulse oximeter is working in. Some of this room light can also reach the detector. The pulse oximeter has to work with these three sources of light. It wants the red and infra red light to calculate oxygen saturation. On the other hand, the room light is unwanted “noise”, and needs to be taken account of. The way it does this will be explained.
The above diagram shows both LEDs lit to make the explanation easier. In reality, both LEDs are never lit together. Instead, the pulse oximeter rapidly switches the LED’s on and off in a particular sequence. First, the pulse oximeter activates the red LED light. The red light goes through the finger (not shown, to make image less crowded) and reaches the detector. Stray room light also reaches the detector. The detector therefore records red light and room light that falls on it.
Next, the pulse oximeter switches off the red LED light and switches on the infrared LED light. The infrared light goes through the finger (not shown) and reaches the detector. Stray room light also reaches the detector. The detector therefore records infrared light and room light that falls on it.
Finally the pulse oximeter switches off both the red and infrared LED lights. Now the only light that falls on the detector is the room light. The pulse oximeter now records the room light level.
Because the pulse oximeter now knows the level of room light, it is able to subtract it from the readings to get the actual red and infrared light levels.
The animation below shows the LED’s switching on and off in sequence. The animation is shown in slow motion to make it easy to understand. In reality, this switching happens hundreds of times per second.
So here is the sequence:
Only red LED is on. Sensor measures red plus room light.
Only infrared LED is on. Sensor measures infrared plus room light.
Both LEDs off. Sensor measures only room light.
Problems with pulse oximeter
Problem of movement
When you think of problems associated with pulse oximeters it is important to remember that the signal that is analyzed is really tiny. As explained before, it is only about 2 % of the total light that is analyzed.
Which such a small signal, it is easy to see how errors can occur. Pulse oximeters are very vulnerable to motion, such as a patient moving his hand. As the finger moves, the light levels change dramatically. Such a poor signal makes it difficult for the pulse oximeter to calculate oxygen saturation.
Problem of optical shunting
The pulse oximeter operates best when all the light passes through arterial blood, as shown in the upper finger in the image below. However, if the probe is of the wrong size or has not being applied properly, some of the light , instead of going through the artery, goes by the side of the artery (shunting)(lower finger in image below). This reduces the strength of the pulsatile signal making the pulse oximeter prone to errors. It is therefore important to select the correct sized probe and to place the finger correctly in the chosen probe for best results.
Problem of too much ambient light
As discussed before, in addition to the light from the LEDs, ambient (room) light also hits the detector. For good functioning of the pulse oximeter, the strength of the LED light falling on the detector should be good when compared with the strength of the ambient light falling on the detector.
If the ambient light is too strong, the LED light signal gets “submerged” in the noise of the ambient light. This can lead to erroneous readings.
Therefore, it is important to minimise the amount of ambient light falling on the detector. One can try and move away strong sources of room light. One can also try and cover the pulse oximeter probe and finger with a cloth etc.
Problem of electromagnetic interference
Electrical equipment such as surgical diathermy emit strong electric waves which may be picked up by the wires of the pulse oximeter. These waves ( shown in green below) make small currents form in the wires, confusing the pulse oximeter which assumes these currents come from the light detector. During diathermy use, one should be cautious about interpreting pulse oximeter readings.
Problem of poor peripheral perfusion
A good peripheral blood flow makes the arteries in fingers nicely pulsatile. As discussed before, it is the pulsatile change in absorbance that is used in the calculation of oxygen saturation.
When the peripheral perfusion is poor (e.g. in hypotension), the arteries are much less pulsatile. The change in absorbance is therefore less and the pulse oximeter may then find the signal inadequate to correctly calculate oxygen saturation.
Problem of not detecting hyperoxia
In the beginning , we discussed that oxygen saturation refers to how much of the hemoglobin is carrying oxygen. In the example below, all the hemoglobin are carrying oxygen, and therefore the oxygen saturation is 100 %.

However, hemoglobin is not the only way oxygen is carried in blood. Additional oxygen can also be dissolved in the solution in which red blood cells travel (plasma). The problem is that the pulse oximeter cannot “see” the extra dissolved oxygen. So even though this patients blood is full of extra oxygen, the saturation still shows 100 %, instead of say 120 %.
The 100 % saturation in the above example tells us that the patient is getting enough oxygen. However, it does not tell you that the patient is getting too much oxygen (hyperoxia). Oxygen, while necessary for life, can be harmful if given in excess. Therefore, other means (e.g. arterial blood gas) have to be used to detect hyperoxia.
Problem of calibration
As mentioned before, pulse oximeters are calibrated using humans. This means that low saturations may not be accurate.

Problem of Colored dyes and nail polish
The dye, methylene blue, if in the patients circulation, will artificially lower the displayed oxygen saturation. Finger nail polish can affect the accuracy of saturation determination.
Problem of abnormal hemoglobins
Abnormal hemoglobin can affect pulse oximeter readings. Carbon monoxide combines with hemoglobin to form carboxy hemoglobin (carboxy Hb). Most pulse oximeters cannot separately detect carboxy Hb. Instead, it considers carboxy Hb as oxy hemoglobin. This is dangerous as carboxy Hb doesn’t carry oxygen, and the artificially high oxygen saturation displayed may wrongly reassure everyone. Another abnormal hemoglobin , called methemoglobin, causes the saturation to falsely show readings towards about 85 %

We have now reached the end of our discussion on pulse oximetry. I hope it has given you a good introduction to the subject and will help you when you read further on this topic. This website is funded mainly by donations, so if you can help, please do consider contributing somethng small as described below. Also, I don’t have an advertising budget, so please do tell your colleagues near and far about this website ! Many thanks.
Hello! My name is Pras and I am the author of this website that you are now reading. I have made this website completely free to access so that people from all over the world can benefit from it.
If you can afford it, I would be very grateful if you would consider making a single donation of one dollar (or the equivalent in your currency) to help cover the expenses needed to run this website (e.g. for special software and computers). For this website to survive, donations are desperately needed. Sadly, without donations, this website may have to be closed down.
Unfortunately, perhaps because many people think that someone else will donate, this website gets only very few donations. If you are able to, please consider making a single donation equivalent to one dollar. With support from people like you, I am sure that this educational website will continue to survive and grow.