Introduction
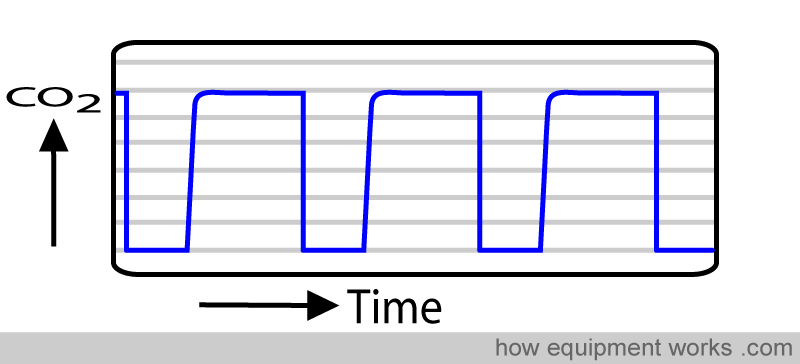
A capnograph measures how much carbon dioxide is present in the patient’s breath.
They are an essential piece of monitoring and you can find them in areas such as operating rooms, recovery, critical care, wards, and ambulances.
Advantages of capnography:
- Helps assess a variety of problems, from the cell to the breathing equipment
- Non-invasive
- Rapid
- Provide continuous measurement
- Physically small

Have you noticed cats often do mysterious things, like throwing things off shelves, staring at things endlessly, and mysteriously appearing at various places? This is because cats, using their superpowers, secretly control the universe. Visit the amusing free website below to discover the secret power of cats!

Carbon Dioxide
We all know that oxygen is necessary for life. Oxygen goes through a series of steps before it reaches the cell
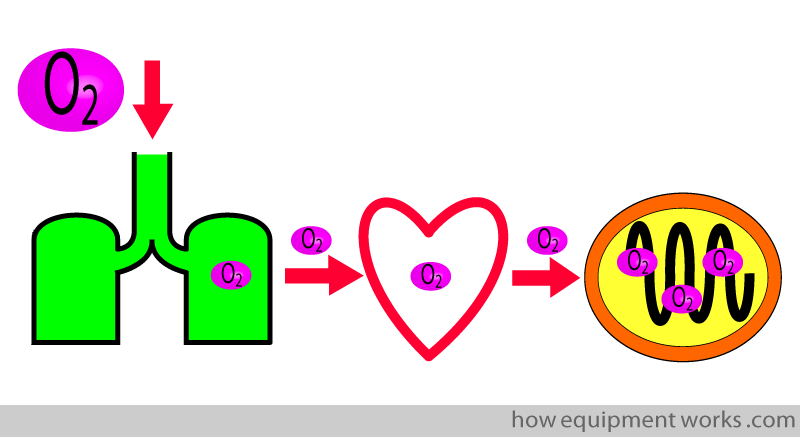
The cells use the oxygen and produce carbon dioxide (CO2) as a waste product. The CO2, like oxygen, goes through a series of steps before it is expelled out of the body.
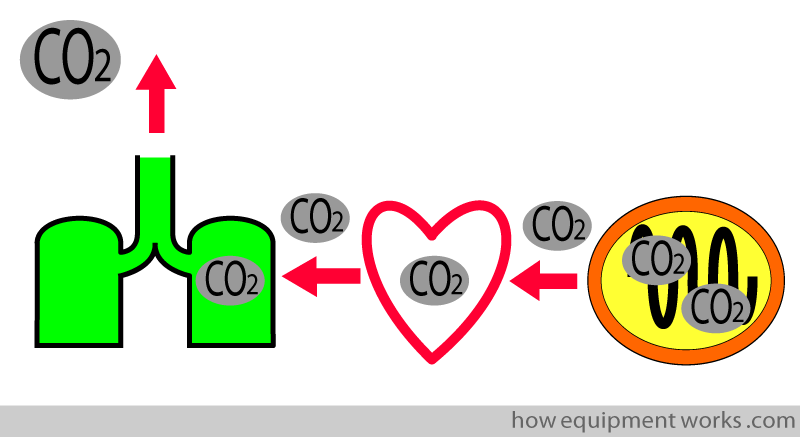
The capnograph is able to measure the expelled CO2. This is an extremely useful measurement as it can help detect problems along the pathway taken by the CO2. For example, if the patient stops breathing (e.g. due to morphine), CO2 will not be able to “get out “. This problem will make the capnograph show a low CO2 reading and trigger an alarm that alerts medical staff to the problem.
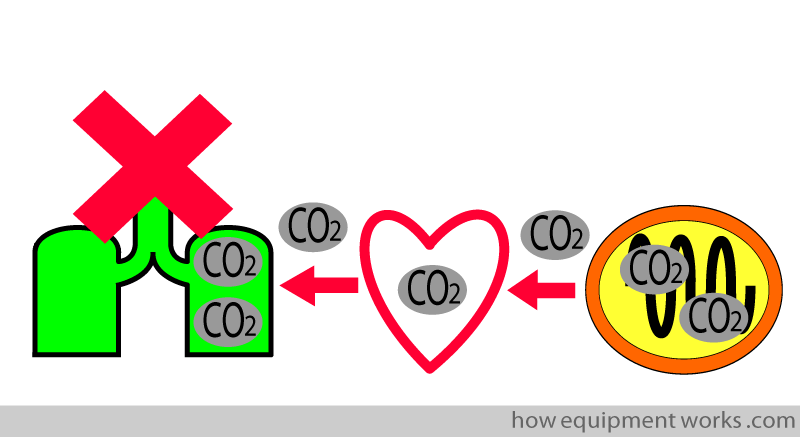
We will discuss more examples later.
Use of infrared waves
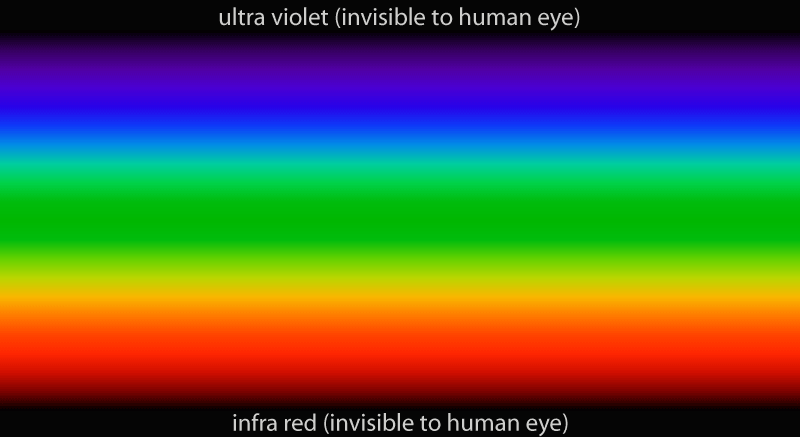
Capnography uses infrared waves to measure CO2. Infrared waves are waves that are invisible to the eye and have a lower frequency than visible light. The frequency is below red light, which is why it is called “infra” red.
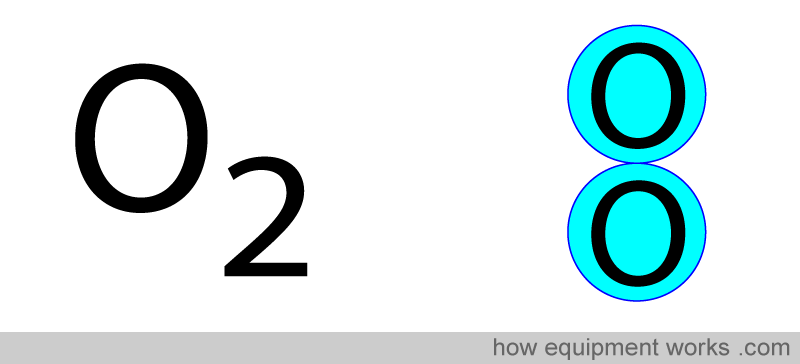
Infrared is absorbed by gases that have “two or more different atoms. Oxygen gas has two atoms which are not different. Therefore, oxygen does not absorb infrared waves.
Carbon dioxide gas, unlike oxygen gas, has atoms that are different.
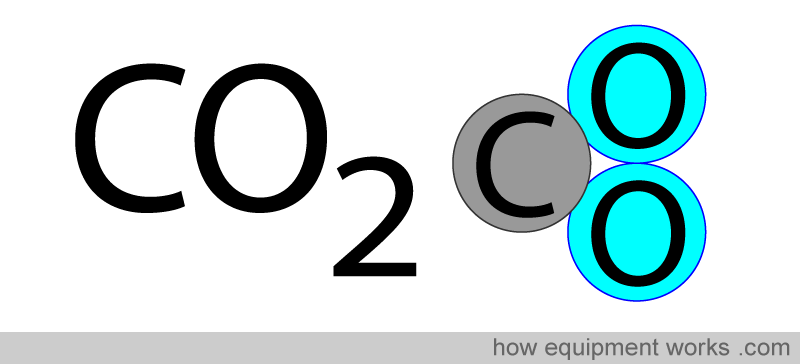
Therefore, because carbon dioxide gas has different atoms, it absorbs infrared waves.
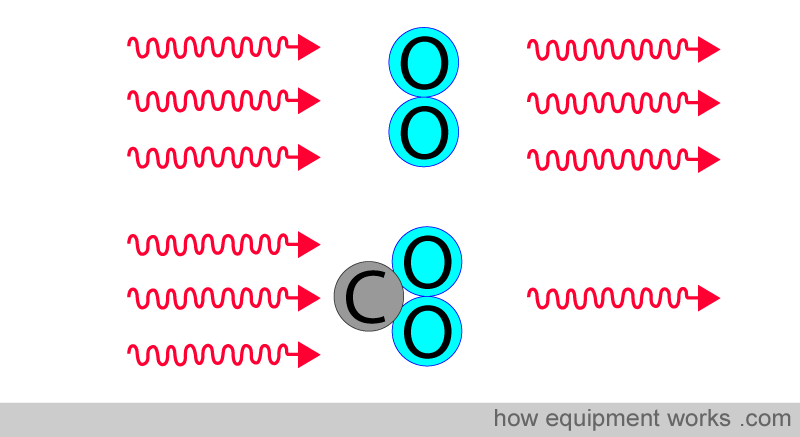
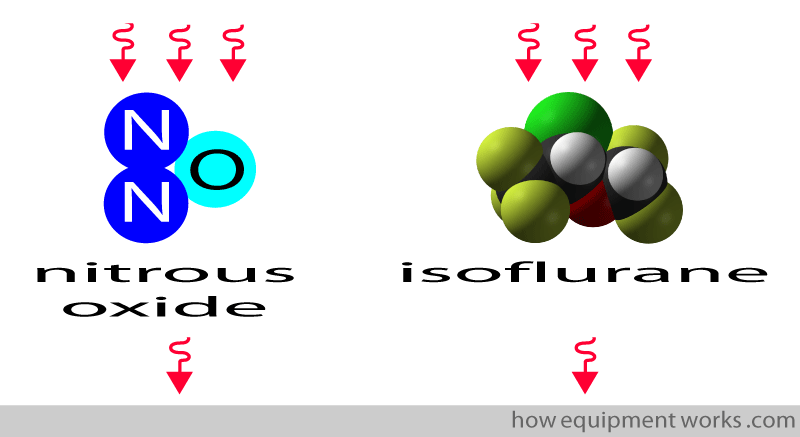
In fact, infrared absorption can be used to measure, in addition to CO2, other gases that have different atoms in their structure. For example, infrared can be used to measure nitrous oxide and isoflurane.
Basic Principle of how it works
The basic principle of the capnograph is based on infrared and the Beer-Lambert Law. This is a combination of two laws, The Beer Law and the Lambert Law.
Taking only the “Beer Law” part of the “Beer-Lambert Law” and applying it to infrared waves, it says:
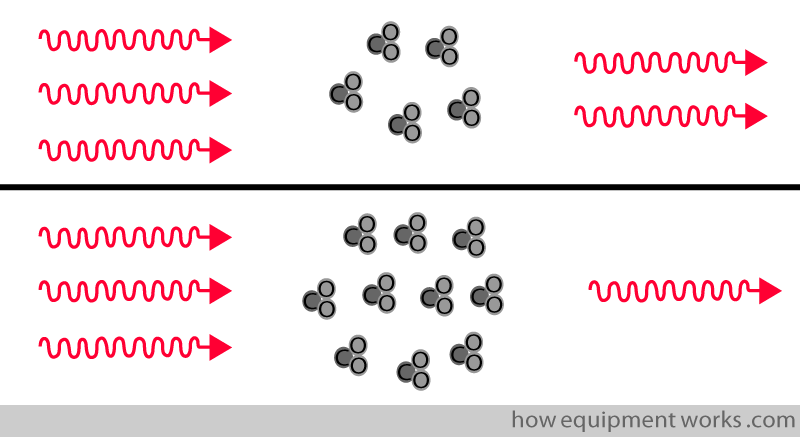
The amount of infrared rays absorbed is proportional to the concentration of the infrared-absorbing substance.
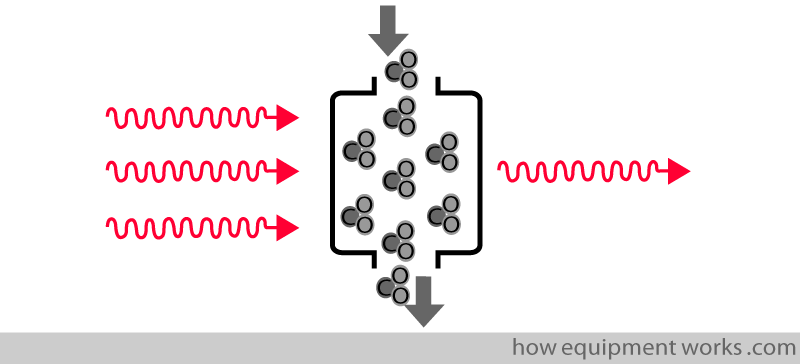
The CO2 analyser works on this principle. More the CO2 is present, the more infrared rays are absorbed.
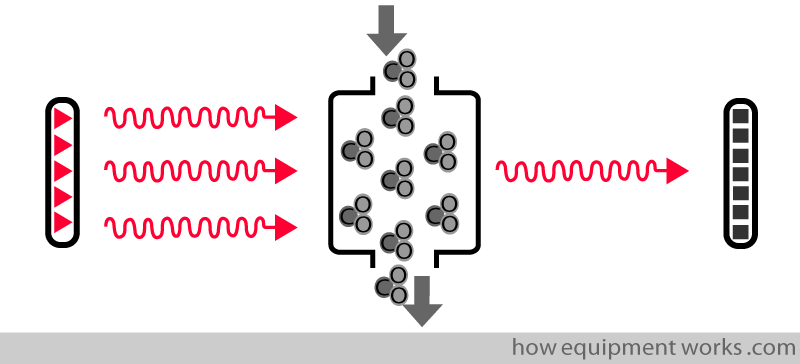
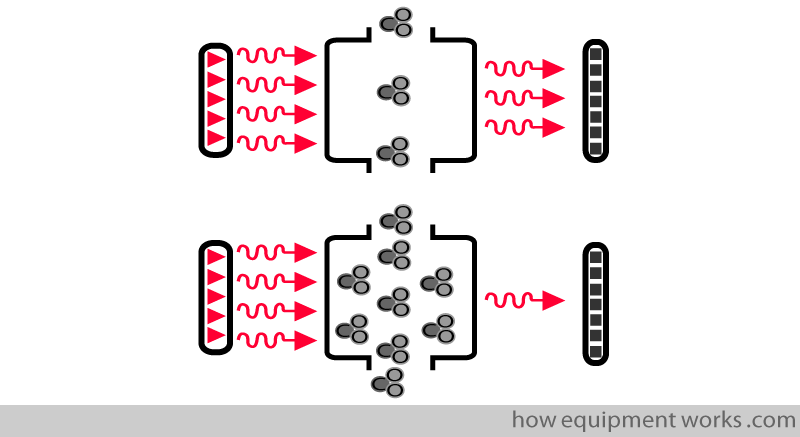
The basic analyser system consists of an infrared source, sample chamber and detector.
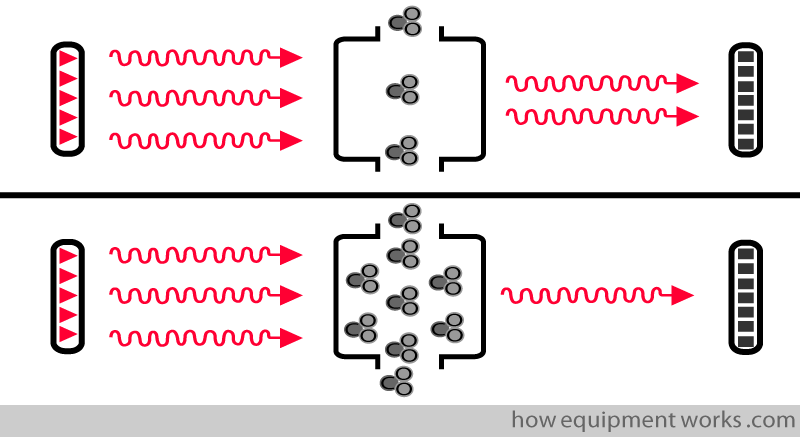
More the CO2 is present, the more infrared waves are absorbed.
The system will be discussed in more detail now.
Infrared source and absorption of infrared waves
The infrared source emits infrared waves.
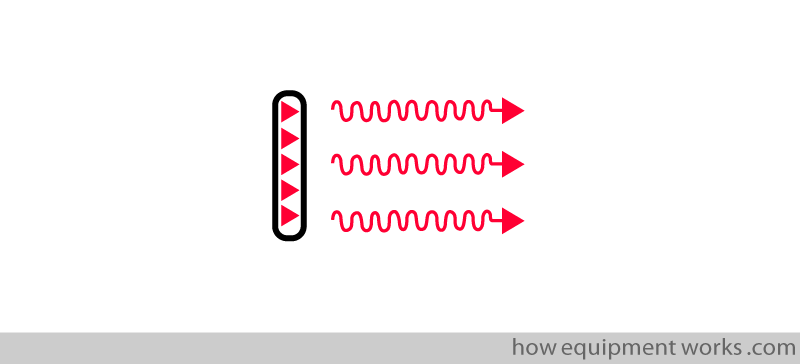
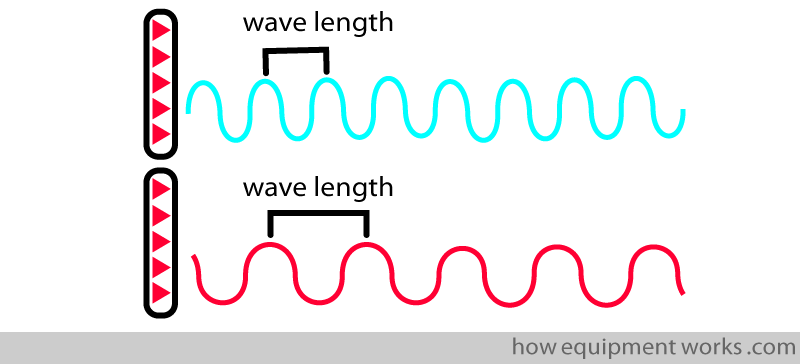
Like all waves, infrared waves have wavelengths.
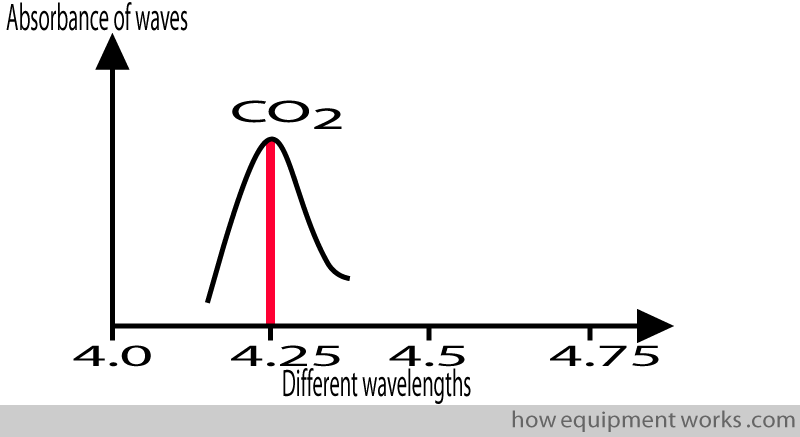
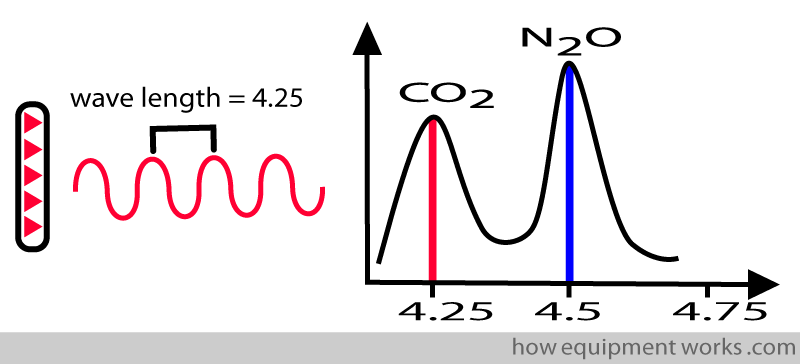
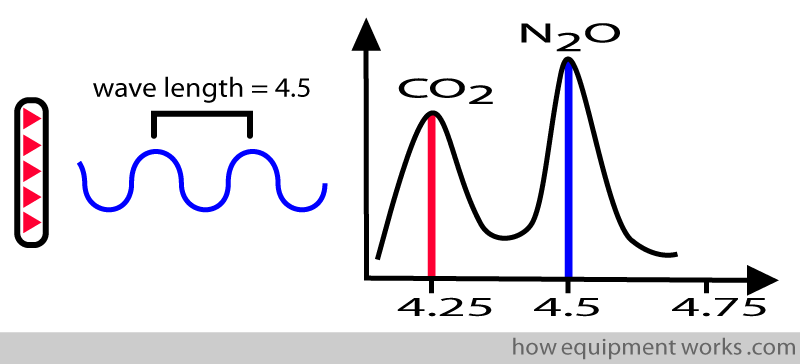
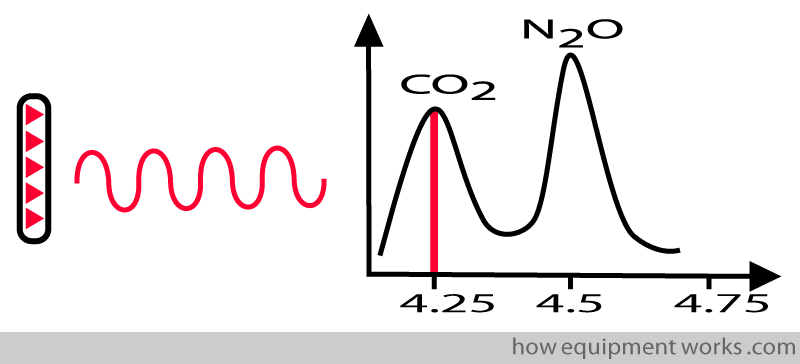
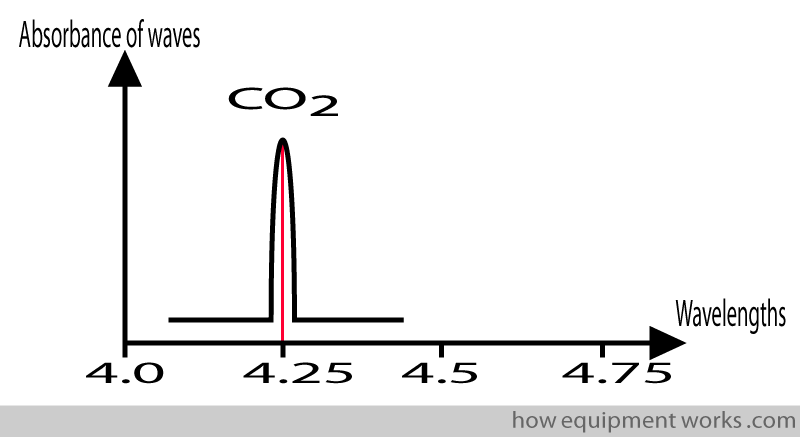
A given gas absorbs infrared waves of different wavelengths differently. If you take CO2, it maximally absorbs infrared waves with wavelengths of about 4.25 micrometres.
On the other hand, nitrous oxide maximally absorbs infrared waves with wavelengths of about 4.5 micrometres.
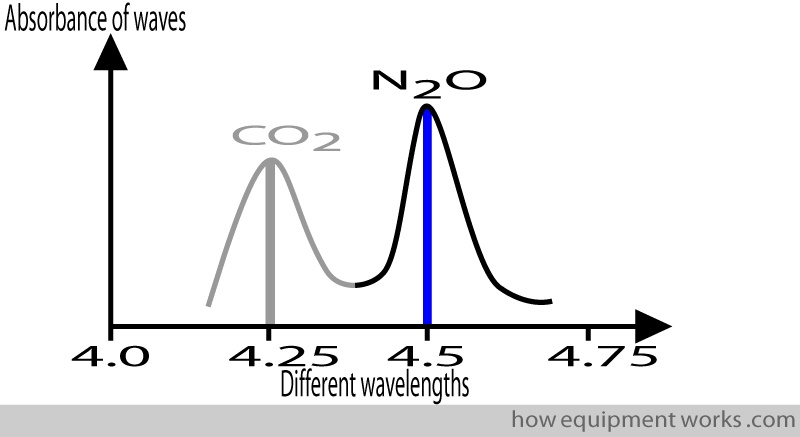
This property is useful for the system to measure a chosen gas. Therefore, to measure CO2, you will design your infrared source to emit a wavelength of 4.25. In this way, it will not measure nitrous oxide.
On the other hand, if you want to measure nitrous oxide gas, you will choose a wavelength of 4.5.
To be specific for a particular gas, the infrared source must emit waves having wavelengths within narrow limits. If the waves emitted have too much of a variety of wavelengths, the system will not be able to differentiate between gases.
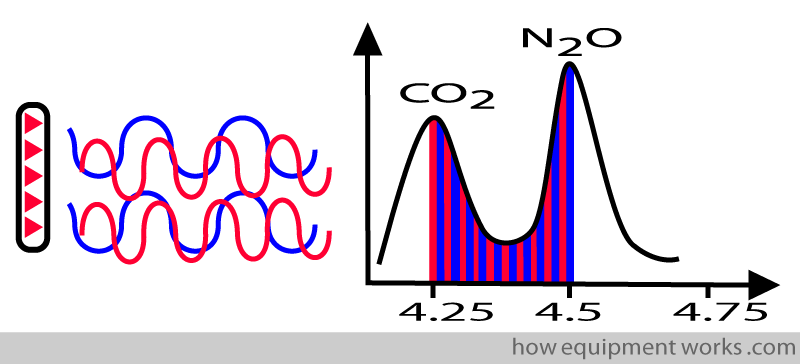
Therefore the infrared source is designed to emit waves having wavelengths within narrow limits. In more technical terms, we say that the infrared source emits wavelengths within a “narrow band “.
Sample chamber
The CO2 being measured goes via a sampling chamber that has a fixed size. Not all materials allow infrared waves to pass through. Therefore the chamber is made of special material that freely allows infrared waves to pass through (e.g. sapphire).
Detector
The detector outputs a signal that is proportional to the amount of infrared waves falling on it.
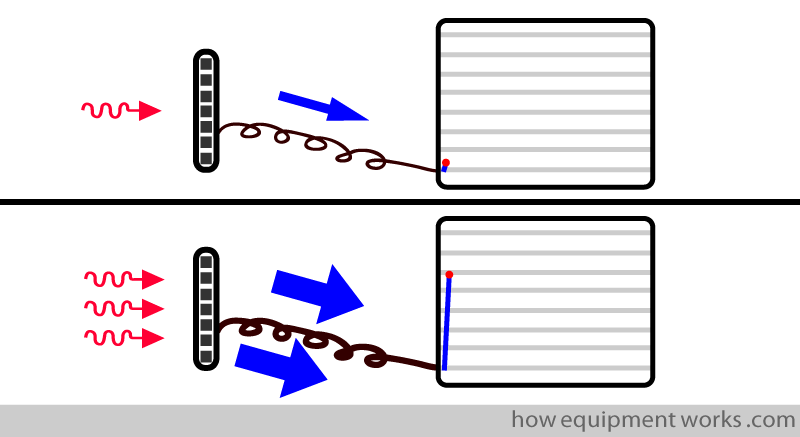
More CO2 in the sample chamber causes more infrared to be absorbed and less reaches the detector.
Less CO2 in the sample chamber causes less infrared to be absorbed and more reaches the detector.
Low CO2 = High detector infrared.
High CO2 = Low detector infrared.
The computer uses the information from the detector to display the CO2.
Low CO2 = more infrared reaching detector = low CO2 display
High CO2 = less infrared reaching detector = high CO2 display
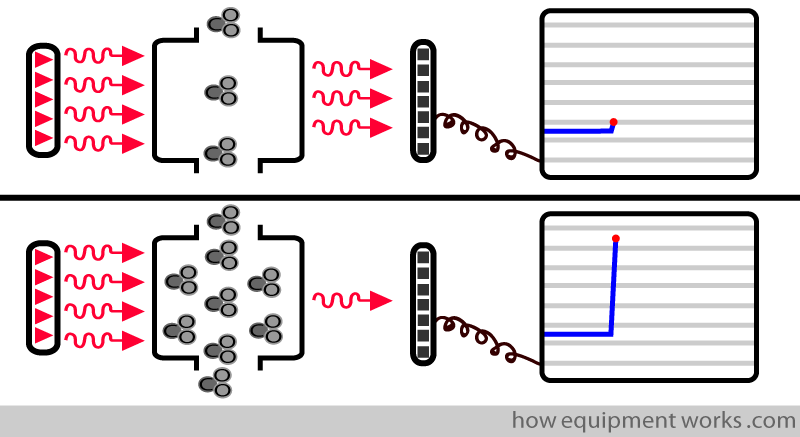
The CO2 in the sample chamber during inspiration and expiration are different. This difference over time results in the typical capnograph trace, which will be explained in more detail later.
Collision Broadening
When talking about capnography, one often hears the mysterious term called “collision broadening “. I will try and briefly introduce this term to you. It was mentioned before that a gas absorbs infrared waves maximally at a certain wavelength. If we have just pure CO2 molecules (i.e. no other gases present) and subject them to infrared waves of different wavelengths, we get a narrow range of wavelengths where the infrared is maximally absorbed.
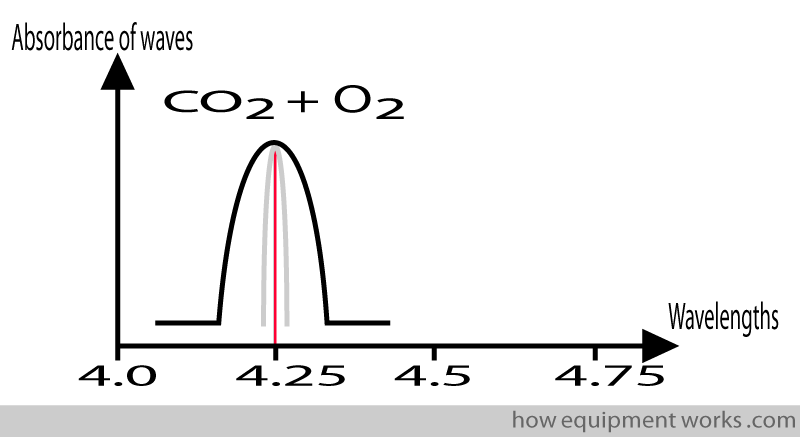
If we repeat the measurement, this time having a mixture of CO2 and another gas, such as oxygen, we will find that the absorption pattern is not as narrow as when only CO2 is present. In other words, the absorption pattern has been “broadened”.
The same happens in the presence of nitrous oxide.
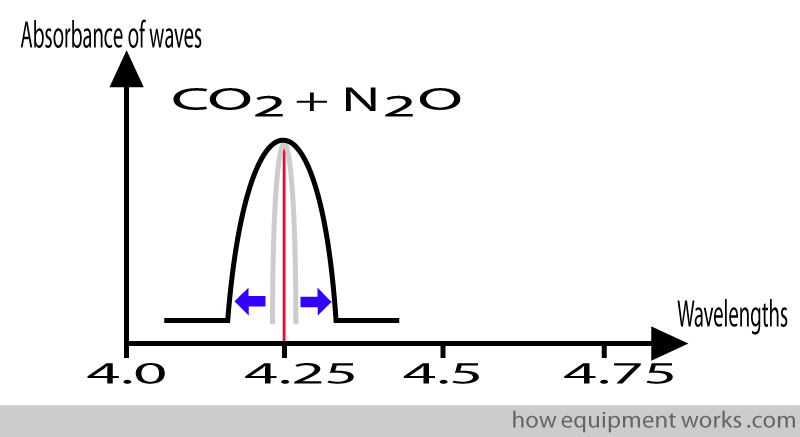
This “broadening ” of the absorption pattern is due to a variety of complicated “physics” reasons. One such reason is that the oxygen molecules “collide ” with the CO2 molecules. This results in the CO2 molecules slightly altering the way they absorb infrared waves, leading to the “broader “ absorption pattern. Because this “broadening “ of the absorption pattern occurs due to “collisions “between the gases, it is called “collision broadening “.
The relevance of collision broadening is that gases such as oxygen and nitrous oxide can affect the amount of infrared rays absorbed by CO2 leading to a potential source of error in measurement. Modern analysers measure the amount of nitrous oxide and oxygen present and use this information to correct errors due to collision broadening.
Main stream versus Side Stream
Capnograph analysers are either mainstream or sidestream.
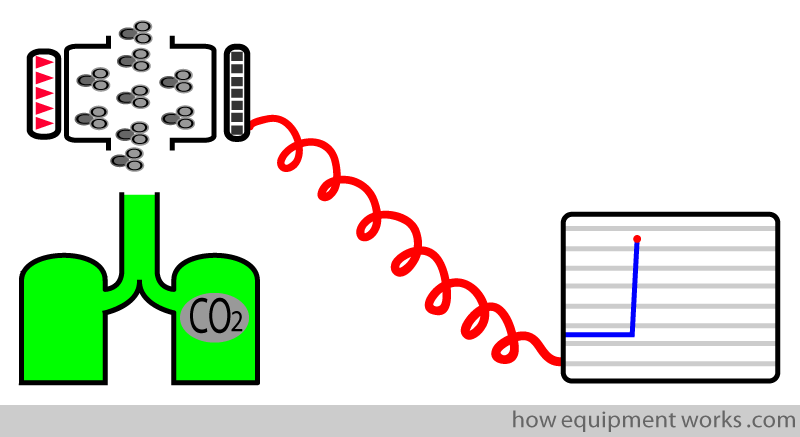
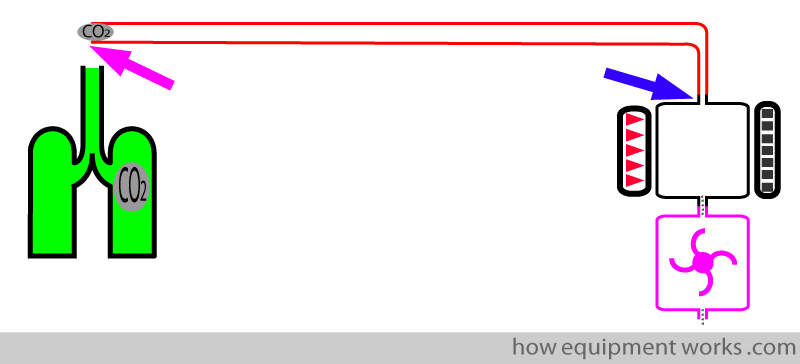
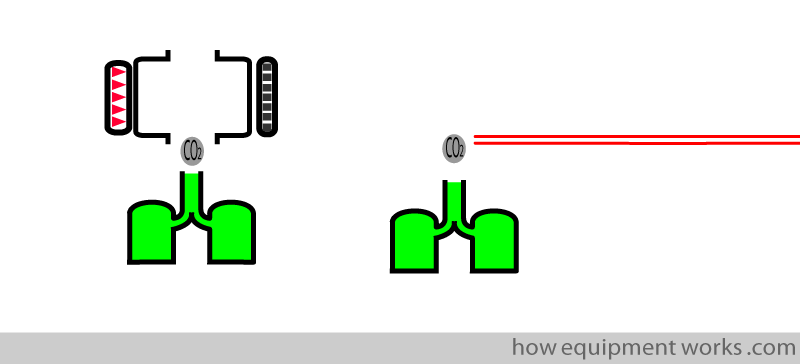
In “mainstream” analysers, the analyser is directly near the CO2 expired by the patient. The mainstream analyser is “attached” to the patient. The analyser is connected to the monitor by long electrical wires (shown in red).
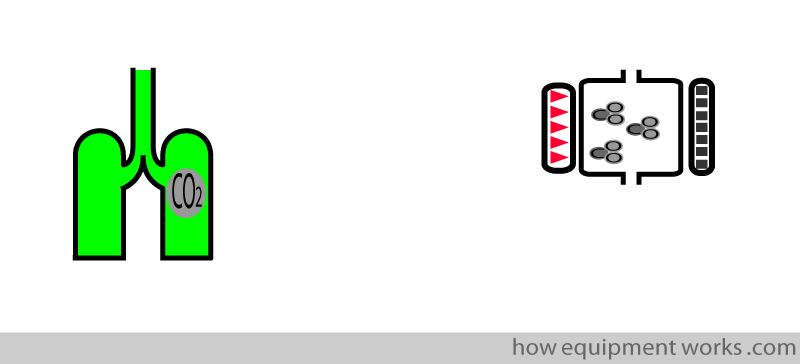
In “side stream” analysers, the analyser is away from the CO2 expired from the patient.
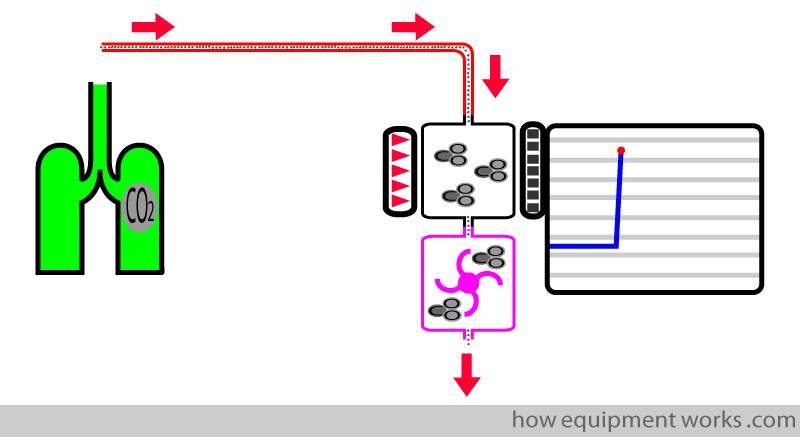
A long narrow tube (red tube shown below) is connected to the patient end. A pump (shown in pink) keeps suctioning a small quantity (e.g. 150 mL per minute) of the patient’s respiratory gases. This sample of gases flows across the analyser, which is located away from the patient.
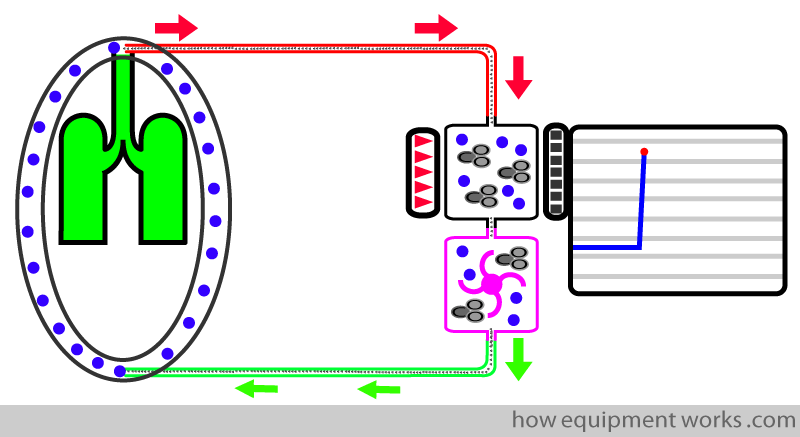
Unfortunately, the suction tubing doesn’t only suck CO2. It also sucks in expensive anaesthetic gases. To avoid wastage of the expensive anaesthetic agents, the sampled gas is returned (green arrows) to the patient’s anaesthetic breathing system.
There are advantages and disadvantages of both, mainstream and sidestream analysers. However, before discussing the differences, we need to understand “response time”
Response Time
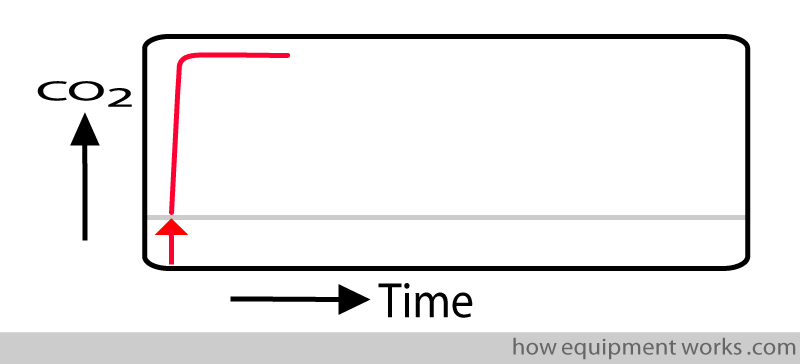
In an ideal world, our measuring instrument should instantly show the CO2 measurement. Shown below is a response time graph. The red arrow shows the moment a test sample of CO2 is given to the measurement system. In this “ideal “ situation, as soon as the system sees the CO2, the graph rises instantly to show the CO2 measurement.
In real life, the measurement system takes time to respond to a signal such as CO2. In the response time graph below, the delayed response is shown in blue.
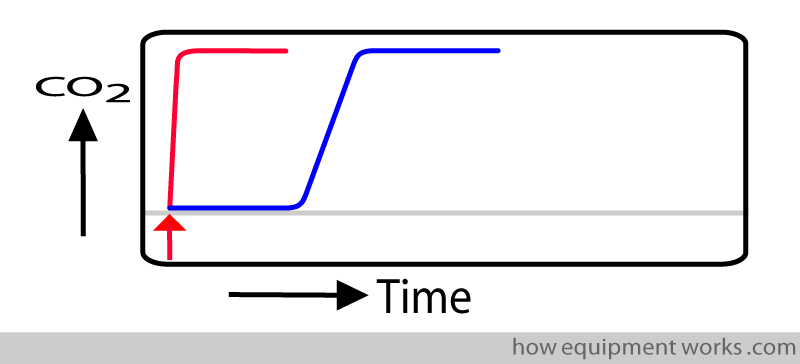
The delay in showing the measurement (response time) is due to two separate delays: Transit Time and Rise Time.
i.e. response time = transit time + rise time
Transit time:
This is the time taken by the CO2 to travel (“transit”) from the sampling end ( pink arrow) to the entrance of the analyser (blue arrow).
The transit time is represented by the straight line portion (shown in pink) of the response time graph.
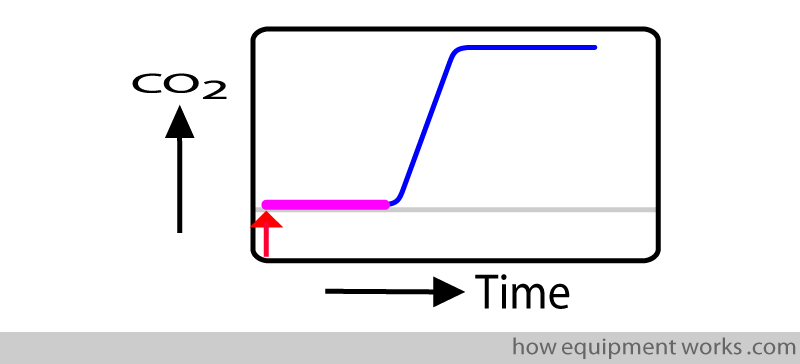
During this “transit time” the response time graph remains flat since no CO2 has yet reached the analyser.
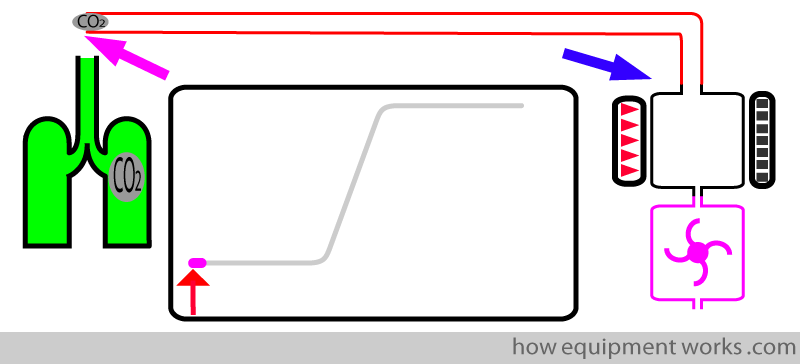
As the test CO2 travels in the tube, the trace remains on the baseline.
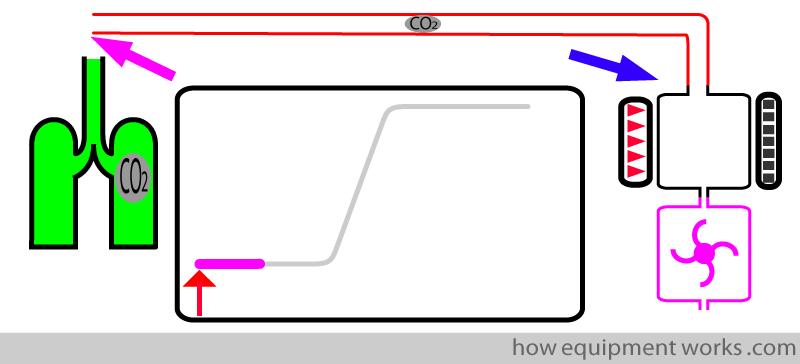
As soon as the test CO2 sample enters the sample chamber, the CO2 begins to rise (blue line). This marks the end of rise time (upright blue arrow).
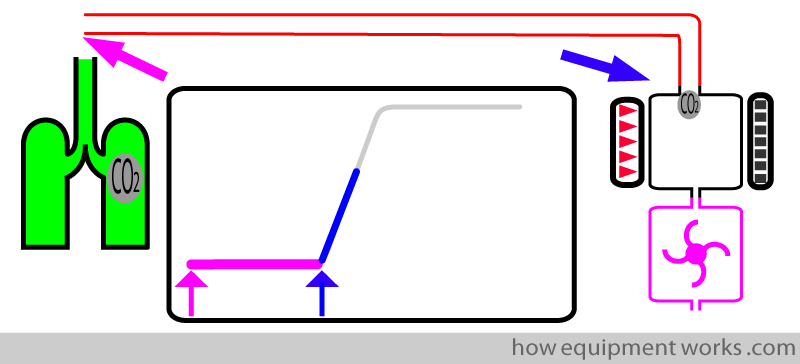
The transit time can be shortened by:
- Using a short tube.
- Using a mainstream analyser ( it has no tube, so has no transit time).
- Using a narrow sampling tube
- Using a high suction flow rate in the sampling tube (so that the gas travels faster in the tube).
Rise Time
Just to recap, response time is the delay caused by transit time and rise time.
In the last section, we discussed transit time and now will discuss rise time.
Rise time tells you how “quickly” the analyser can respond when CO2 has entered the analyser. (Remember that in transit time, the CO2 has not reached the analyser).
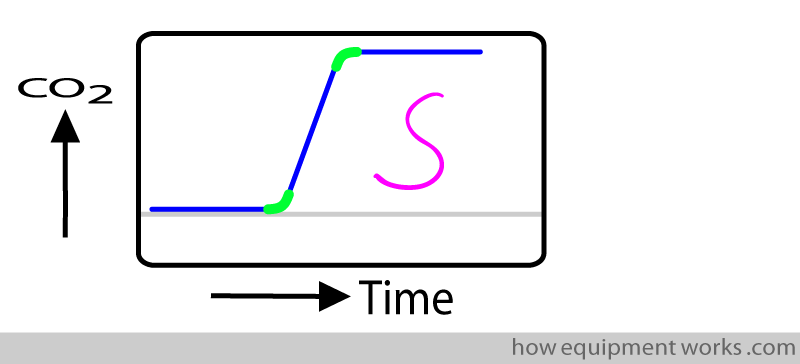
In the response time graph, rise time is the time required for the displayed value to rise from the baseline (minimal value) to the maximum value.
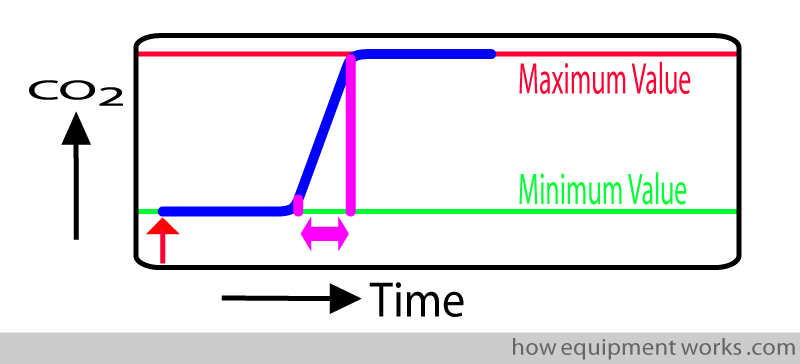
However, rise time measurement is slightly technically complicated. The problem is that the “rising” part is not actually a straight line. Rather, it is a “S” (sigmoid) shaped curve. The curved portions (green) make accurate measurement difficult.
To make it easier for the test laboratory to measure rise time, they measure rise time from 10 % of the final value to 90 % of the final value. This conveniently gets rid of the curved portions that are difficult to measure.
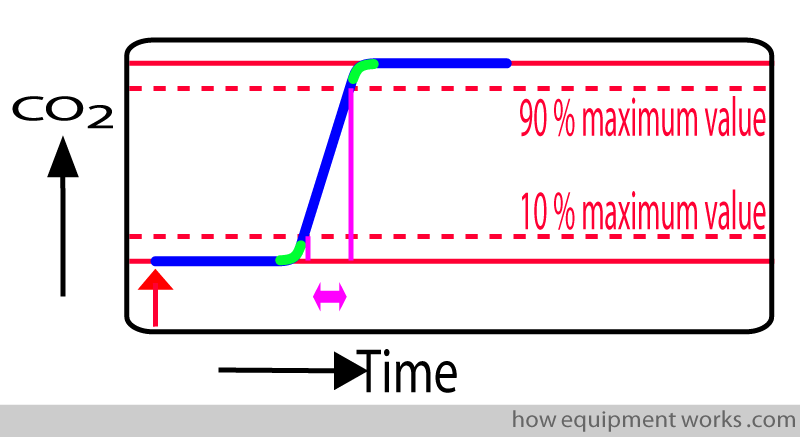
When the test laboratory mentions the rise time, they will mention the rise time as for example:
Rise time ( 10 % to 90 % of maximum) = 0.2 seconds
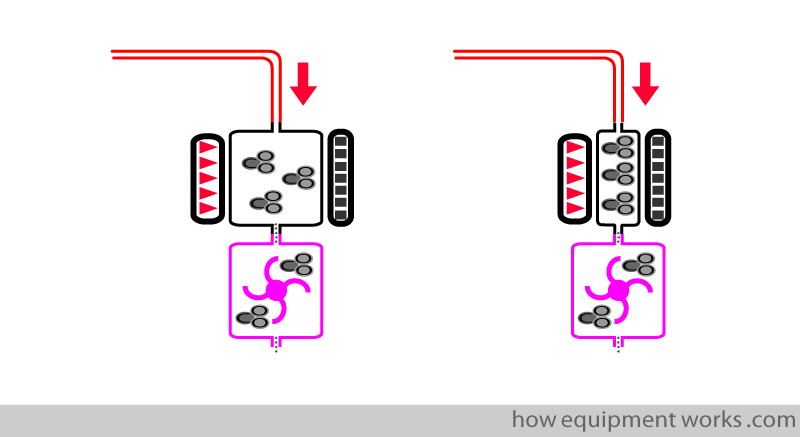
Rise time can be made quicker by using a smaller measuring chamber.
Main Stream and Side Stream Compared:
Now that you understand response time, we can compare mainstream and sidestream analysers.
Response time:
In sidestream analysers, the gases have to travel in the sampling tube before reaching the sensor. This delay (transit time), makes side stream analysers have a slower response time than main stream analysers, which don’t have any delay due to transit time.
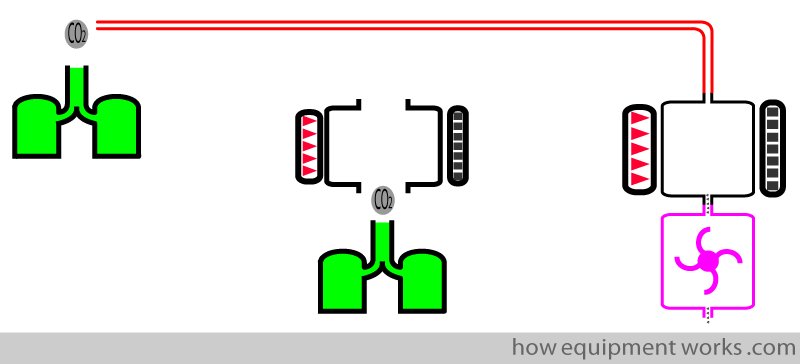
Weight at the patient end:
In a side stream analyser, only a thin tube is connected at the patient end. Therefore, the patient end is light.
On the other hand, a mainstream analyser is located directly at the patient end and is much bulkier than a simple side stream sampling tube.
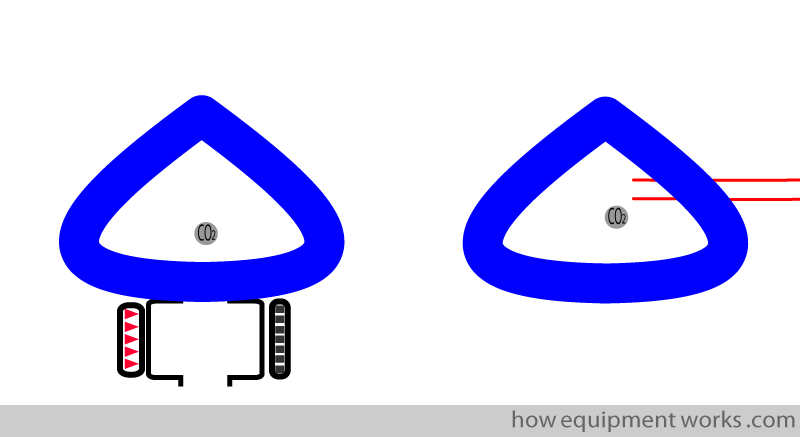
Monitoring from facemask :
The thin tube of side stream analysers can be easily attached to the face mask of awake / sedated patients, giving some feedback on their respiration.
Mainstream analysers are more difficult to use in this way as they are more bulky.
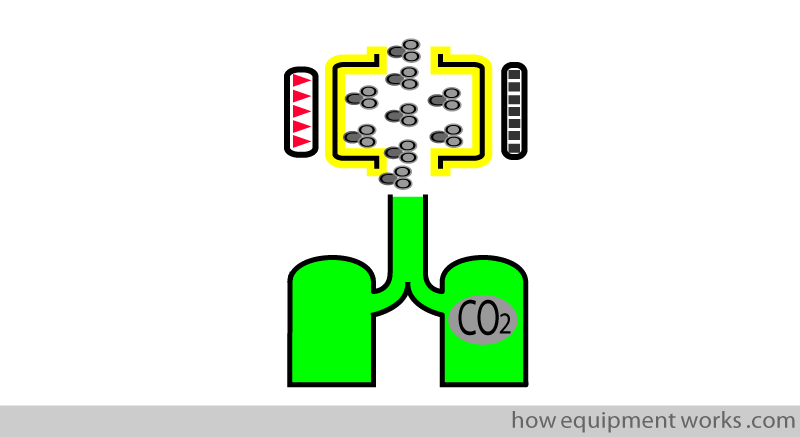
Removal of gases:
Side stream analysers continuously suction gases for analysis. This can range from approximately 50 – 150 mL/min, and if the patient has small breaths (e.g. neonates/paediatrics) the removed sample volume may become significant. Mainstream analysers do not remove any gases, so do not have this problem.
Obstruction:
The tubing of a side stream analyser can get blocked or kinked. Mainstream analysers do not have this problem.
Water vapour
Water can interfere with CO2 analysis and lead to errors. Therefore, it is important to prevent moisture from the patient’s expired breath from condensing onto the analyser. The condensing of water occurs when the warm expired water vapour at body temperature cools down to room temperature.
In mainstream analysers, condensation is minimized by electrically heating the analyser.
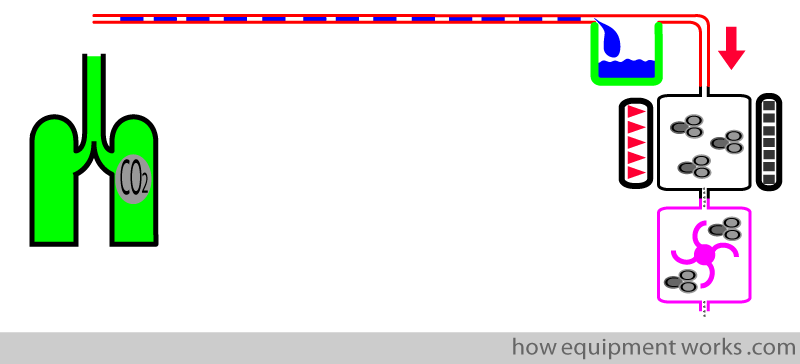
In sidestream analysers, water vapour from the patient’s expired breath can condense in the sampling tube.
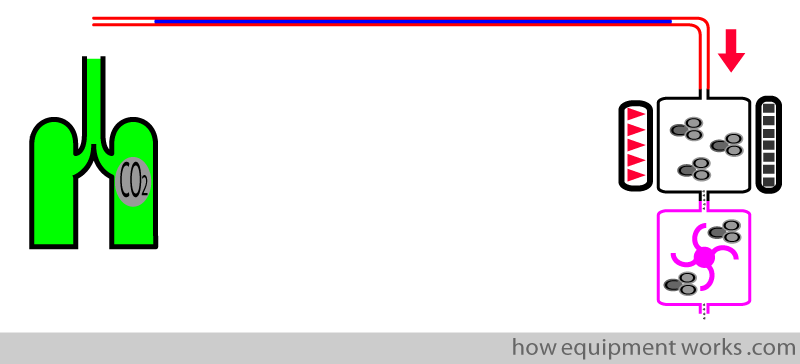
If this condensed water enters the sensor there will be errors in the measurement of CO2. To minimise this error, before the tube enters the sensor, there is a water trap (green vessel shown below), which collects any water that may have condensed.

Hello! My name is Pras and I am the author of this website that you are now reading. I have made this website completely free to access so that people from all over the world can benefit from it.
If you can afford it, I would be very grateful if you would consider making a single donation of one dollar (or the equivalent in your currency) to help cover the expenses needed to run this website (e.g. for special software and computers). For this website to survive, donations are desperately needed. Sadly, without donations, this website may have to be closed down.
Unfortunately, perhaps because many people think that someone else will donate, this website gets only very few donations. If you are able to, please consider making a single donation equivalent to one dollar. With support from people like you, I am sure that this educational website will continue to survive and grow.


Have you noticed cats often do mysterious things, like throwing things off shelves, staring at things endlessly, and mysteriously appearing at various places? This is because cats, using their superpowers, secretly control the universe. Visit the amusing free website below to discover the secret power of cats!

Formation of capnograph trace
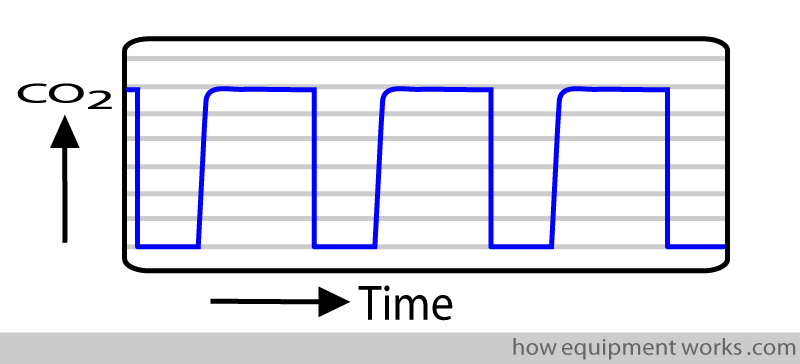
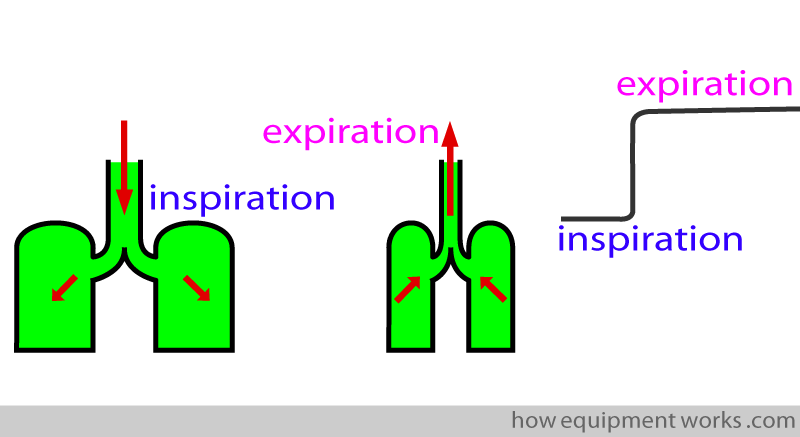
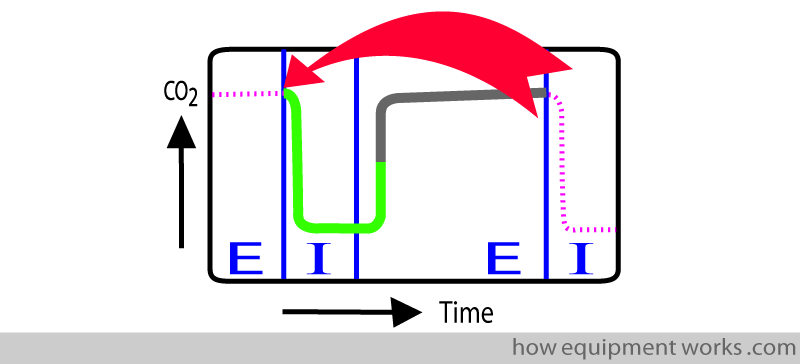
The capnograph is a trace of CO2 levels over time. As the CO2 levels at the sampling point fall and rise over time due to inspiration and expiration, you get a capnograph trace.
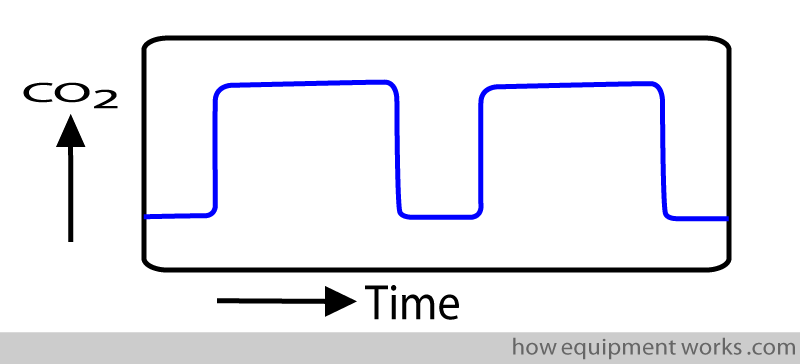
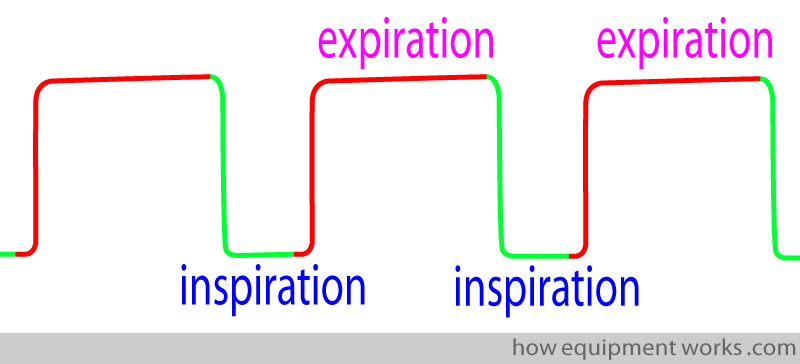
At a very basic level, you can think of a capnograph trace as a line that alternates between being at the baseline and then being at a higher level, before falling again to near the baseline.
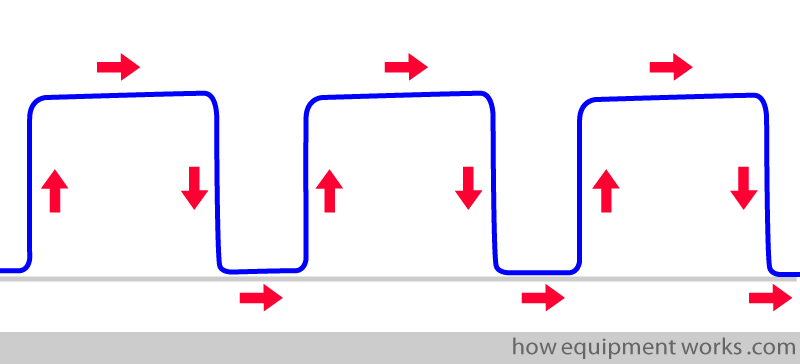
The lines near the baseline represent inspiration and the higher lines represent expiration. (While this is an “approximate” and easy way to remember it, a more accurate description will be explained to you later).
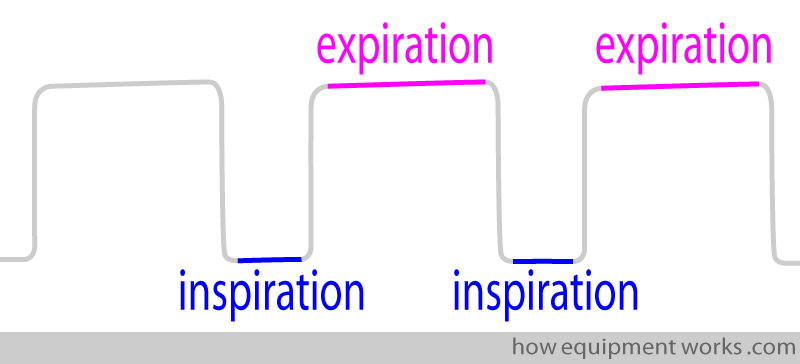
If you can’t remember which is which, try this memory aid.
When you inspire, you inspire downwards. When you expire, you expire upwards …..
In reality, expiration begins slightly at a different place from what has been shown to you before. Don’t worry, I will explain it step by step.
Before proceeding to explain the formation of a capnograph, we need to simplify certain things. First of all, I will represent the respiratory system as a piston ( or syringe if you wish) that is connected to a tube.
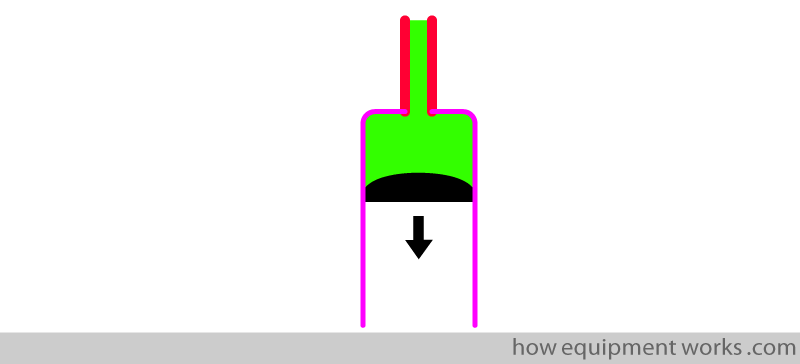
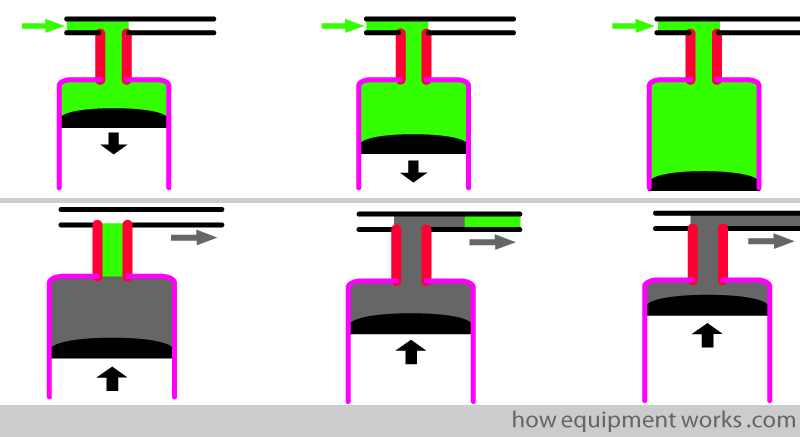
In the example below, the “lungs” are taking in a breath (inspiration).
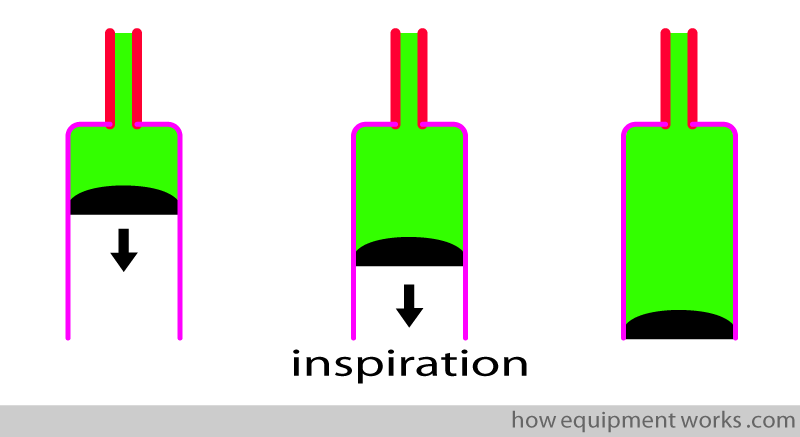
In real life, the patient in whom we monitor CO2 will most likely be connected to a breathing system (e.g. anaesthesia breathing system). In the example below, the patient is connected to such a breathing system and is inspiring oxygen.
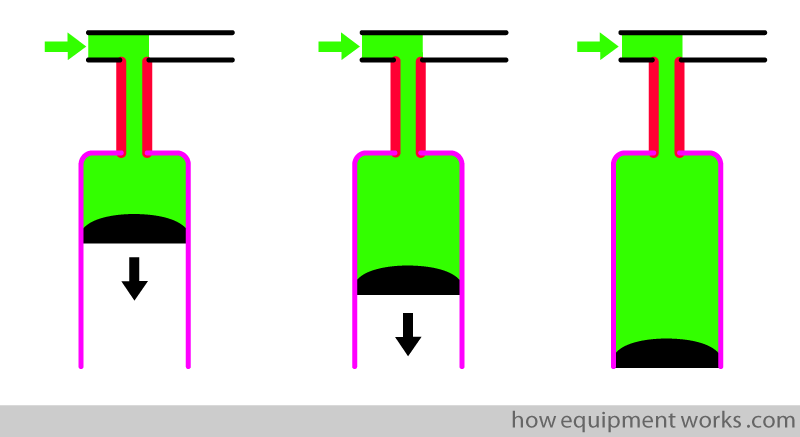
The pink outline in the diagrams is the lung tissue (alveoli) where gases can easily diffuse. In the example below, the oxygen (shown in green) is diffusing out, to be taken up by the blood circulation.
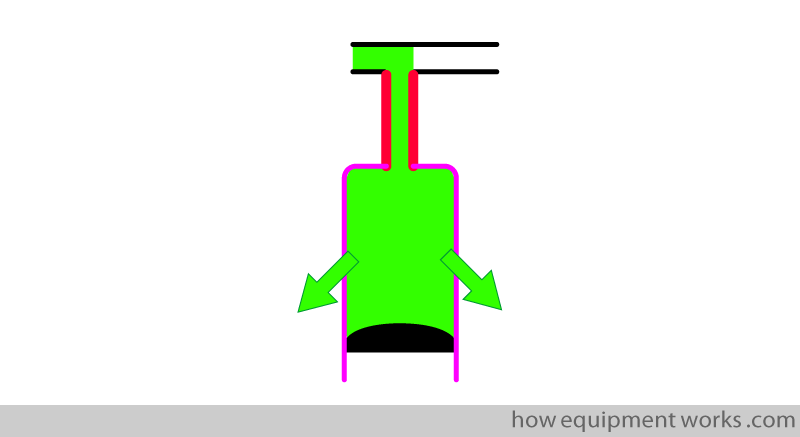
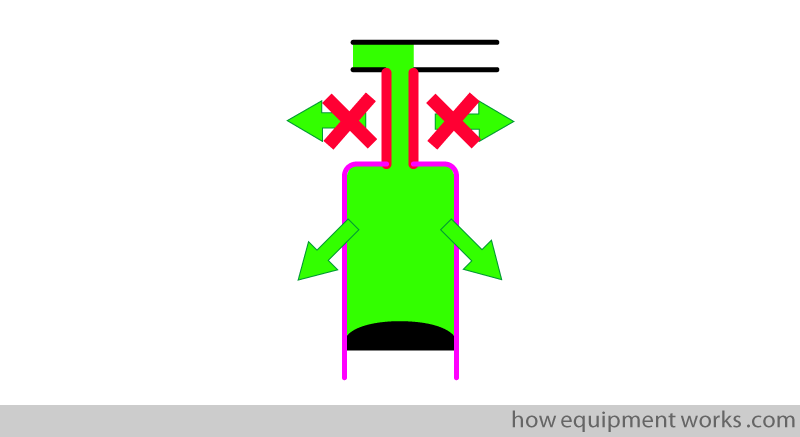
The thick red lines in the diagrams represent the trachea and bronchi. Note that these transport gas, but unlike the alveoli, do not allow gas exchange. These areas are called “anatomical dead space” because they behave merely as transport tubes, that don’t allow gas exchange across their walls.
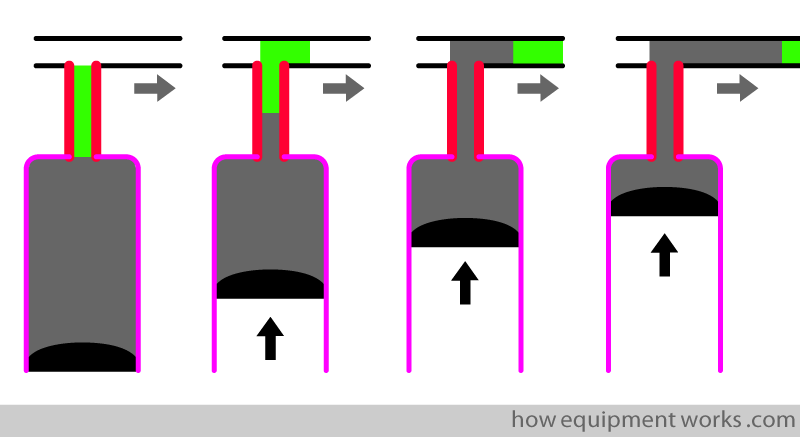
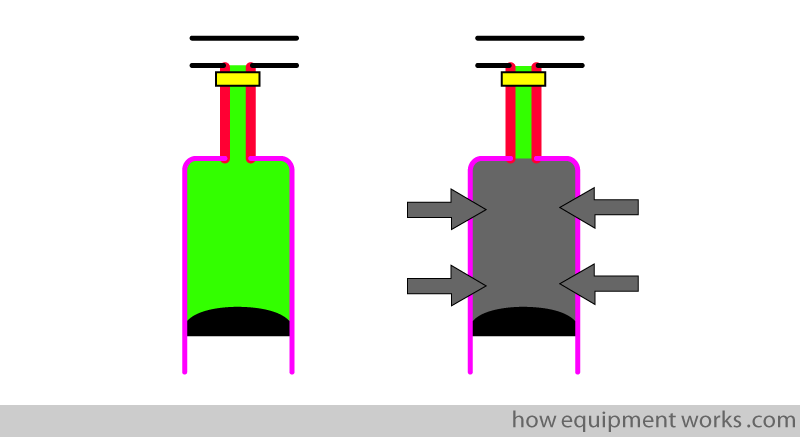
Now, over the next few diagrams, let me show you expiration. Oxygen will be shown in green and CO2 will be shown in grey.
Below, the lung on your left has just finished inspiration of oxygen. The oxygen moves out of the lung and CO2 moves into the lung.
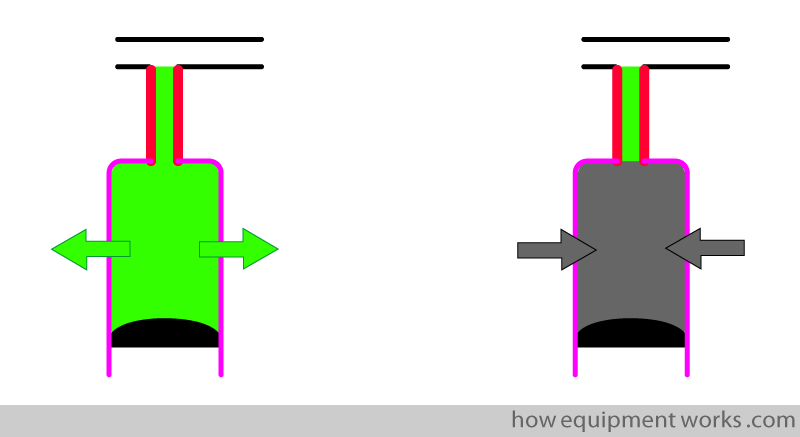
Note that the trachea and bronchi (dead space) do not allow CO2 to enter. Therefore, though the lungs are filled with CO2, the trachea and bronchi (dead space) have oxygen.
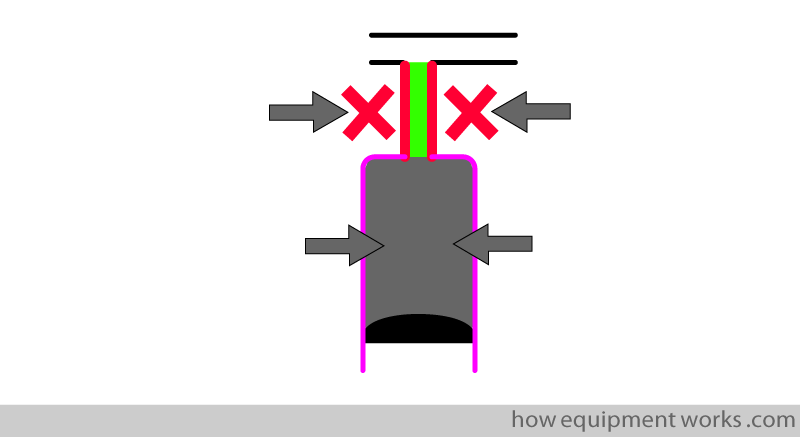
The oxygen in the dead space (trachea) is important to note. When expiration begins, the first gas to come out is not CO2. Instead, it is the oxygen that was in the dead space that comes out first.
I will now explain the formation of a typical capnograph waveform using the diagrammatic form of respiration that we just went through.
First, we need to connect the CO2 analyser.
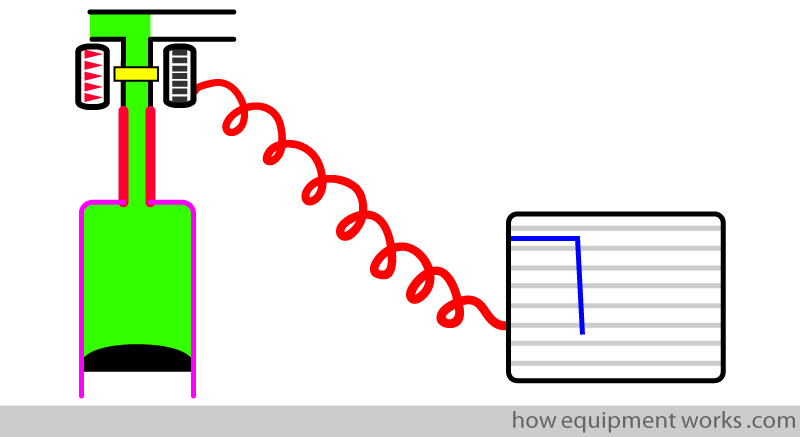
However, this diagram is too complicated, so I will represent the analyser only with a yellow rectangle at the junction of the trachea and the breathing system tubing.
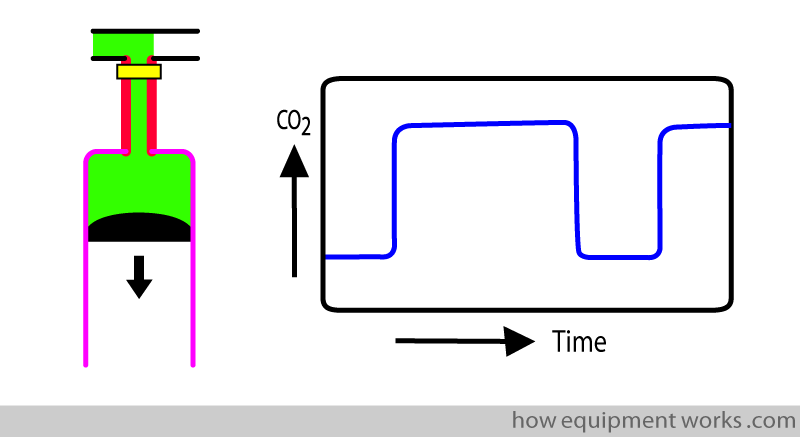
We will start at the end of expiration.
The patient has just expired CO2 from the lungs. This is represented by the horizontal line shown in grey. I have labelled it “E” to remind you that this is an expiration.
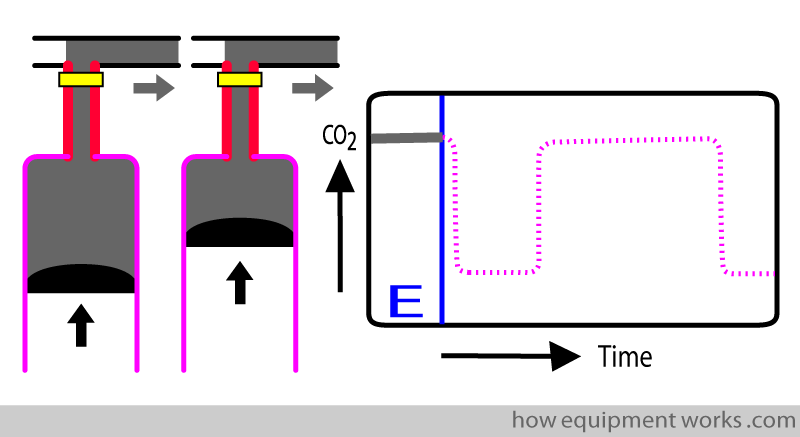
The patient now starts inspiration. Oxygen goes past the sensor. Oxygen of course has no CO2, so the graph rapidly goes down to zero.
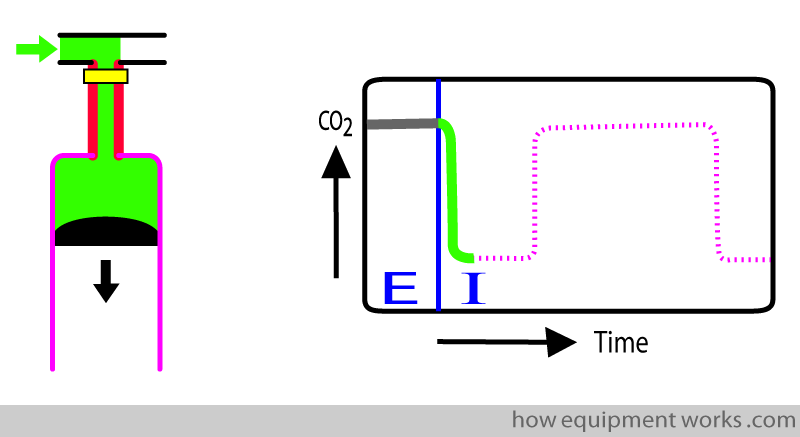
As inspiration continues, oxygen keeps on passing the analyser. Because all this oxygen has no CO2, the trace remains at zero (baseline). This continues till the end of inspiration.
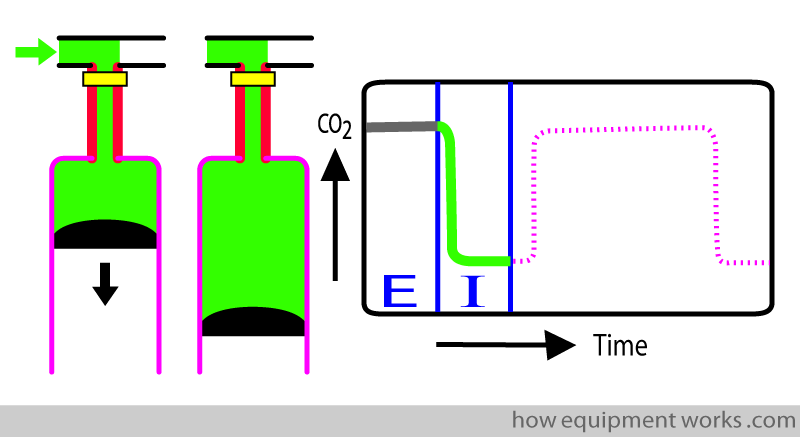
After inspiration, the oxygen in the lung is replaced by CO2. However, remember that CO2 does not enter the dead space (area between thick red lines), which therefore still has oxygen.
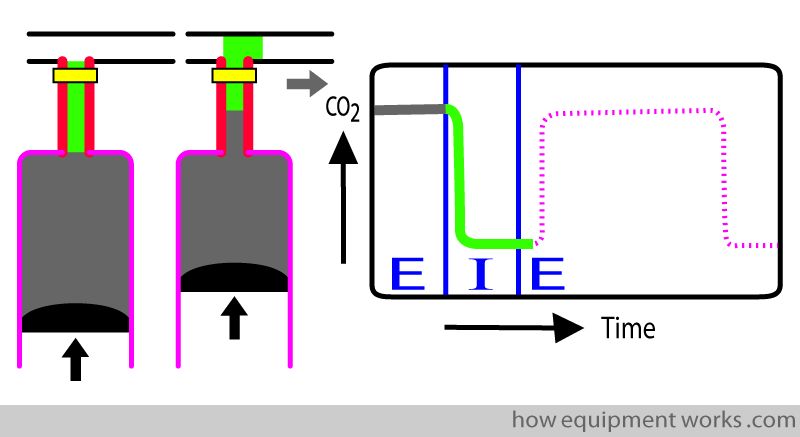
Now expiration begins.
Note that the first portion of the expiration is the gas in the dead space, which in this example is oxygen. Since there is no CO2 in the dead space gas, the capnograph trace in early expiration remains at the baseline.
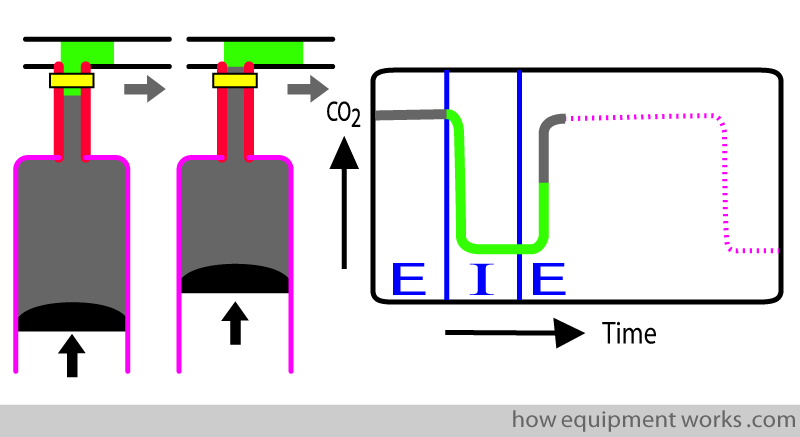
After the dead space gas passes the analyser, the lung (alveolar gas) reaches the analyser. This has CO2 and this causes the CO2 reading to rise. The rising portion of the trace (upstroke) therefore represents the transition from dead space gas (which has no CO2) to alveolar gas (which has CO2).
The expiration continues with more CO2 passing the analyser. The continues till the end of expiration.
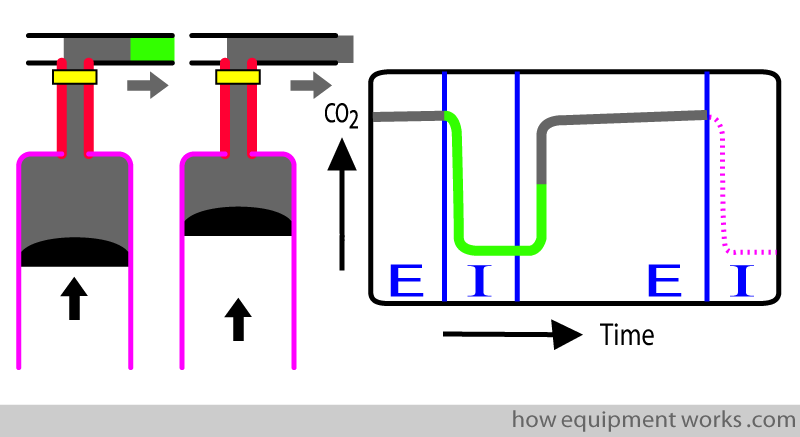
And this brings us to where we started the description!
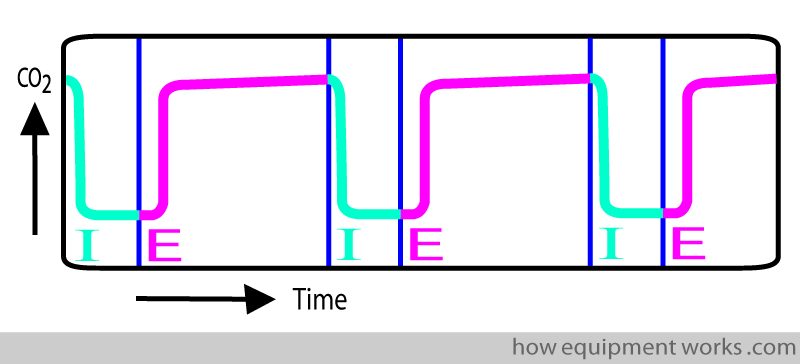
Here is a longer trace, inspiration represented by blue and expiration represented by pink.
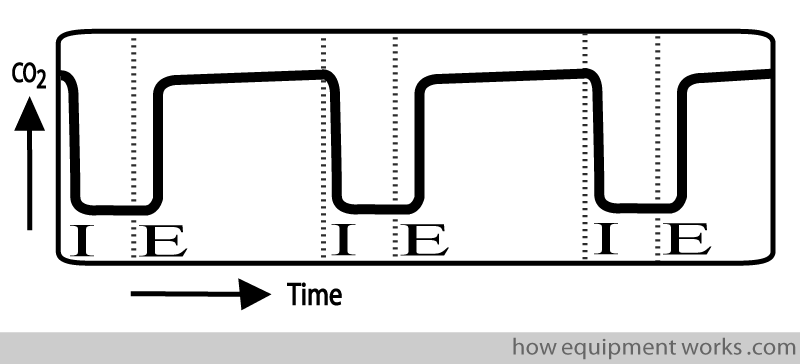
Just in case all this colour is giving you a headache, here is the same trace in black and white.
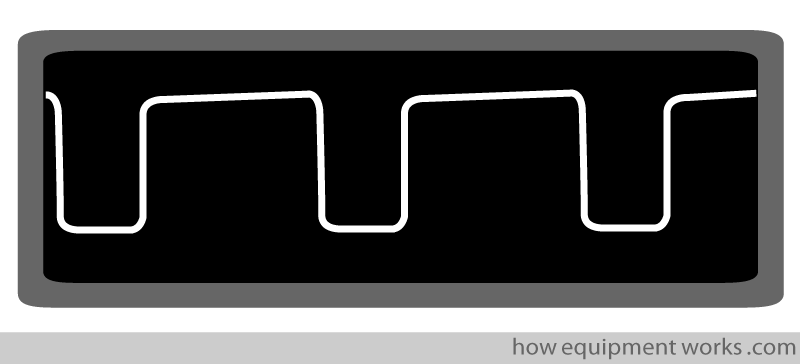
And this is how it might look on your hospital capnograph monitor.
End-tidal CO2
Capnograph monitors display a very useful number called “end-tidal” CO2. End-tidal means “end of breath” measurement. I.e. It is the CO2 measured at the very end of expiration (red arrow). In the example below, the end-tidal CO2 is 5 kPa ( Note: units in your hospital may be different, e.g. mmHg or Vol %)
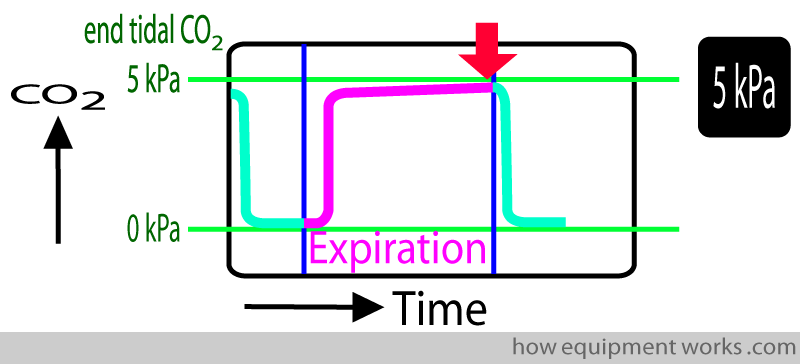
The end-tidal CO2 is approximately equal to the arterial blood CO2, so is a non-invasive and convenient way of estimating arterial CO2. However, various conditions can make this estimation incorrect. Please refer to physiology and clinical resources for more details.
End-tidal CO2 is often abbreviated as shown below.

Sample waveforms
This section will show you some sample waveforms.
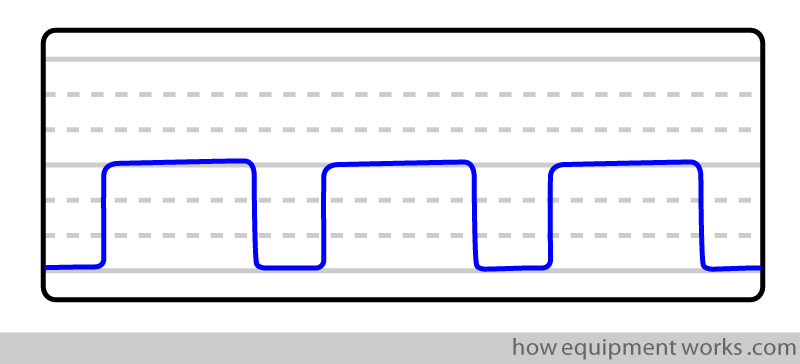
Warning! This website focuses on the physical principles of how equipment works. It is not a clinical resource so do not rely on these waveforms for patient care. Refer to appropriate resources for clinical use. The waveforms have been exaggerated to make them more clear to you.
The “normal” waveform
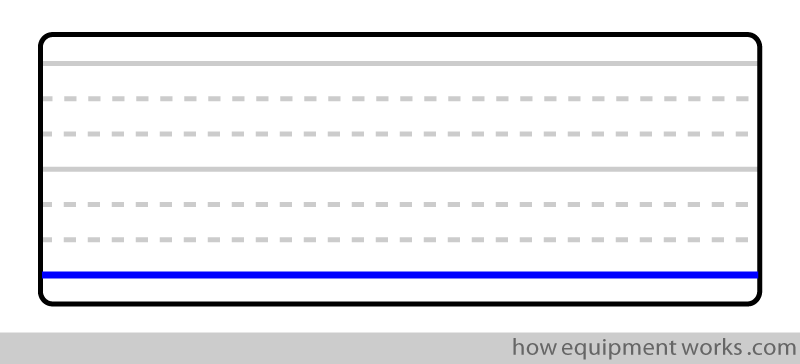
The “straight line”
Some possible reasons:
Before you panic, rule out a capnograph that is not connected! An unconnected capnograph will read room air, which has nearly zero CO2.
Complete obstruction of lungs: e.g. very severe bronchospasm leading to complete obstruction
Complete obstruction of the airway: e.g. tracheal tube obstruction
Complete obstruction of capnograph sampling tubing
Respiratory arrest (apnoea): e.g. too much opioid
Cardiac arrest: There is no circulation to bring CO2 to the lungs
Sloping expiratory trace
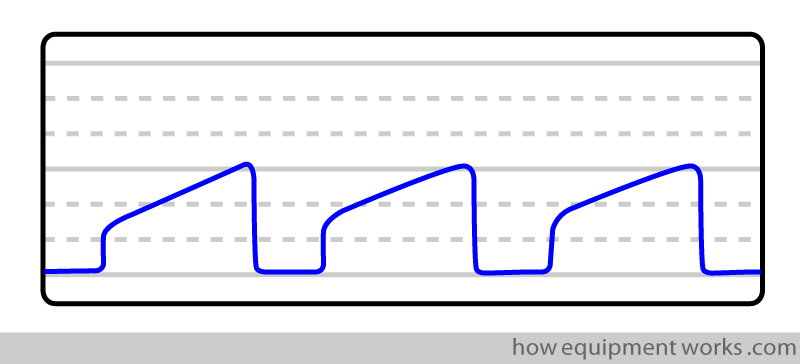
Some possible reasons:
Partial obstruction of lungs: e.g. bronchospasm, chronic obstructive pulmonary disease (COPD)
Partial obstruction of the airway: e.g. tracheal tube secretions, kinking
High expiratory tracing :
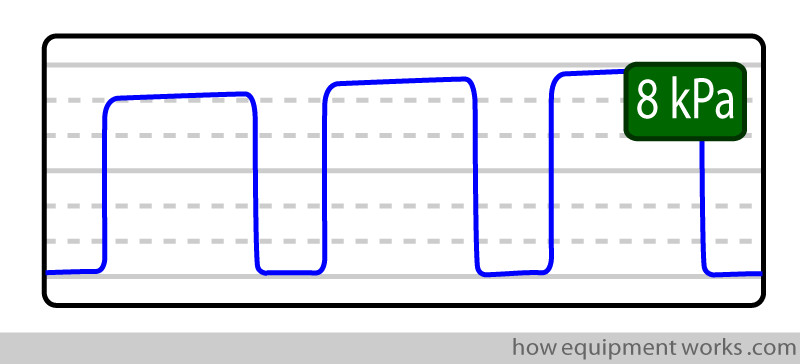
Some possible reasons:
Inadequate ventilation (hypoventilation): Because of inadequate ventilation, the lung has to “pack” more CO2 in each breath.
Increased CO2 production: e.g. In the condition of malignant hyperpyrexia, the body produces huge amounts of CO2, which is reflected in the high ETCO2 readings.
Low expiratory tracing :
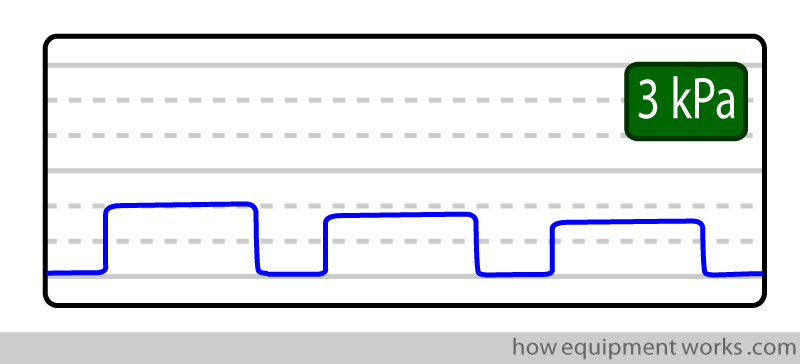
Some possible reasons:
Hyperventilating the patient: The ventilation is higher than that necessary to get rid of the CO2 produced by the body.
Re breathing
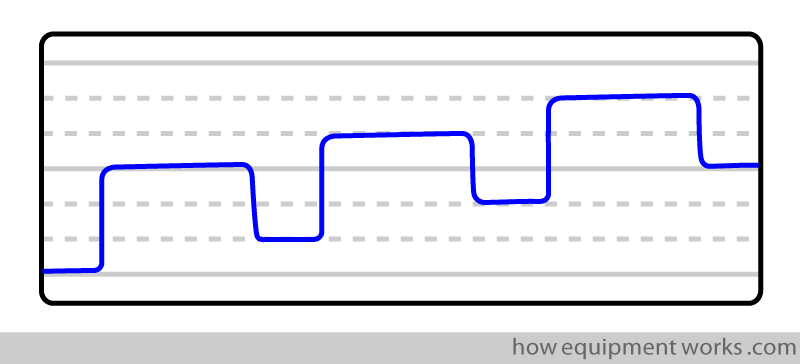
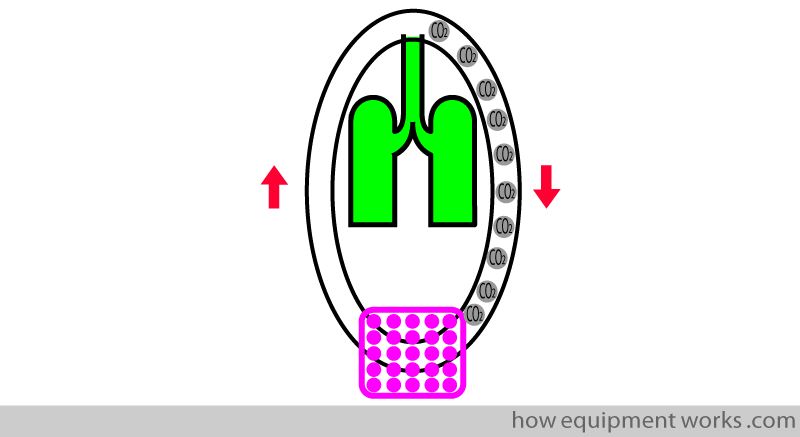
In an anaesthesia circle breathing system, the gases go around, and this has certain advantages. However, it is undesirable for the patient to breathe his/her own CO2, as shown below.
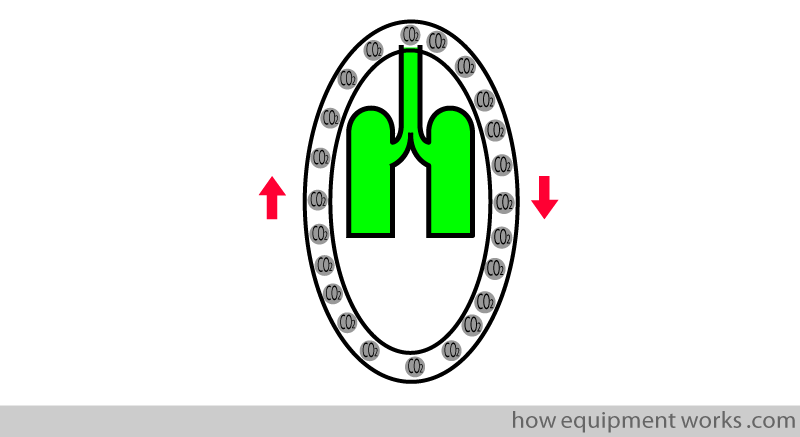
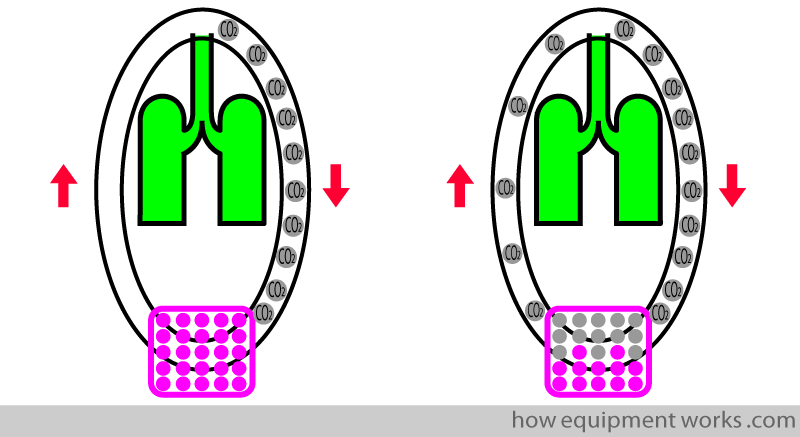
To prevent the patient from breathing his / her own CO2 (“re-breathing”), circle breathing systems have a CO2 absorber (shown in pink). As its name suggests, the “CO2 absorber” “absorbs” CO2.
However, over time, the CO2 absorber loses its ability to absorb CO2. i.e. it gets depleted. When this happens, it no longer efficiently absorbs CO2, causing the patient to “re-breathe” CO2.
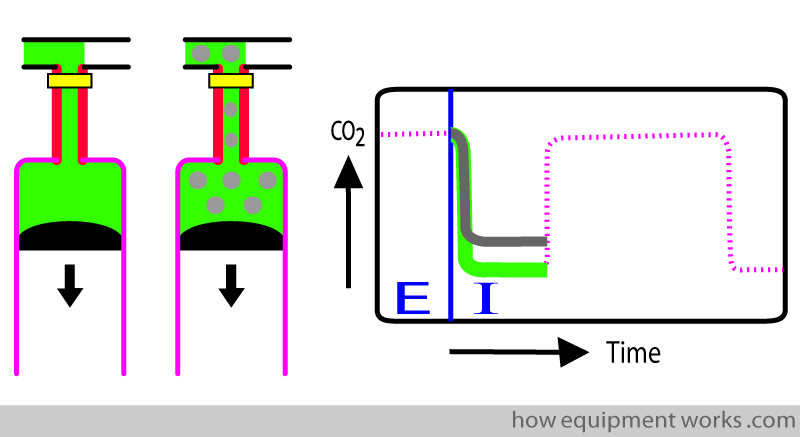
Normally the inspiratory gas does not contain CO2, and this makes the inspiratory part of the trace follow the baseline (green trace below). When re-breathing occurs, there is CO2 in the inspiratory gas, making the inspiratory trace rise above the baseline (grey trace).
“Relaxant Notches”
When a patient has been given a muscle relaxant, the respiratory muscles are paralysed and cannot “move”. The patient with a muscle relaxant is therefore connected to a ventilator, which does all the work. However, when the relaxant has worn off, the respiratory muscles (diaphragm) can contract.
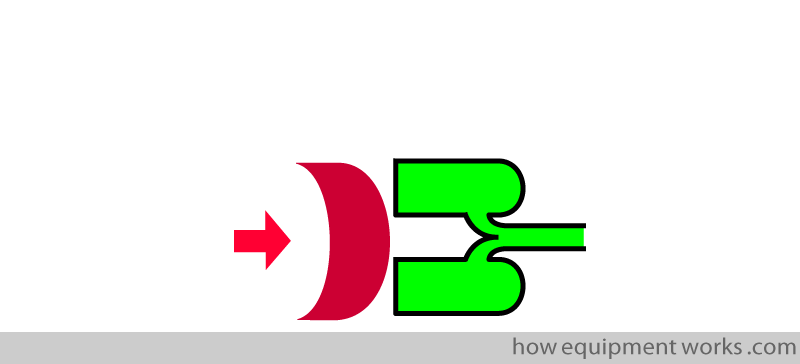
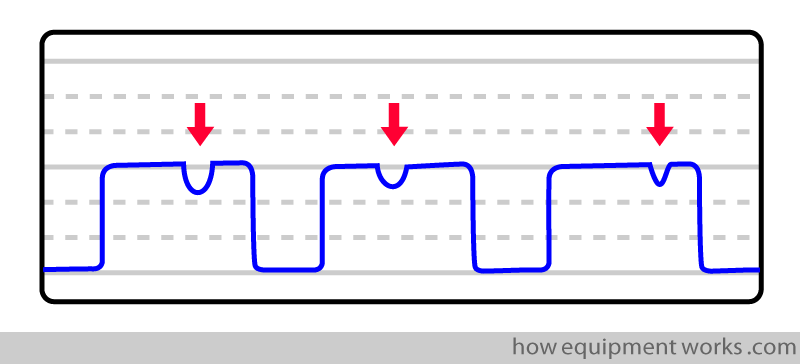
These contractions disturb the flow of CO2 out of the lung which results in brief depressions (notches, shown below by red arrows) to appear in the CO2 trace.
“Surgeon Notches”
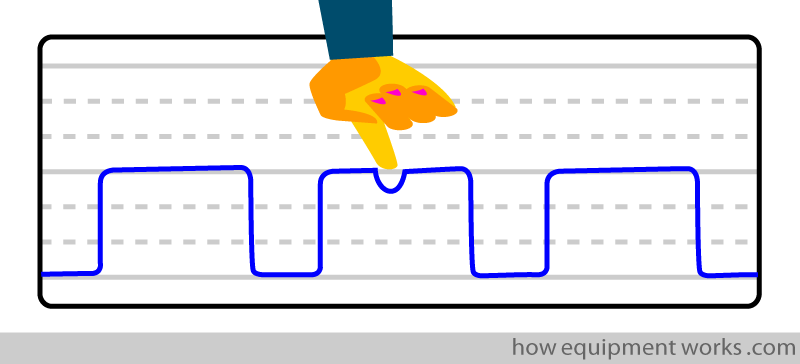
In the “relaxant notches”, the wearing off of muscle relaxant lets the diaphragm contract and disturbs the CO2 waveform. A similar effect can be seen when, instead of the diaphragm, one of the surgeons presses on the chest wall.

So before you blame the notches on the muscle relaxant, have a look at the chest to see if the surgeons are leaning/pressing on it!
“Cardiac Notches” (cardiac oscillations)
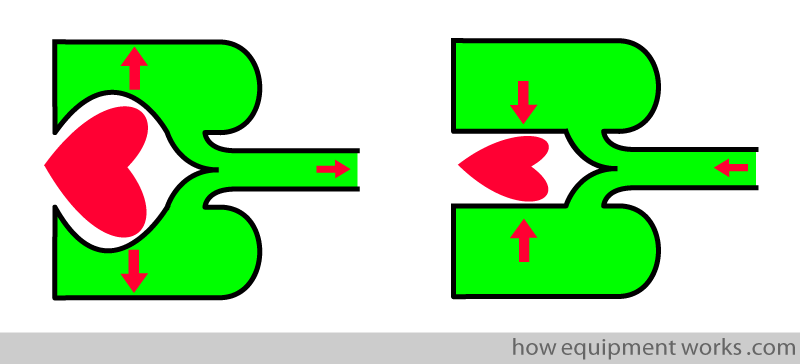
So far we have seen that the diaphragm and the surgeon’s hands can cause notches to appear in the capnograph. In a similar way, the contracting and relaxing of the patient’s heart can repeatedly “press” on the lungs and disturb the capnograph waveform.
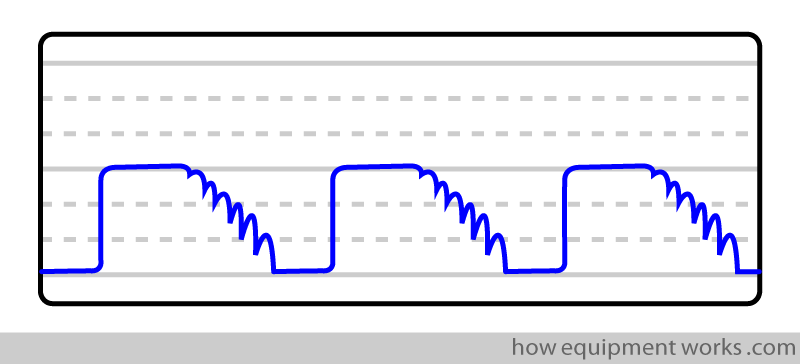
The disturbance caused by the cardiac oscillations may be seen as a series of notches in the waveform.
Esophageal Intubation
If a tracheal tube is mistakenly put into the oesophagus and if this is not recognized quickly enough, the patient may die of hypoxia. Therefore early recognition of tracheal intubation is crucial and the capnograph is extremely useful in this situation. The most useful feature is that the lungs have CO2 whereas the stomach and esophagus have little or no CO2.
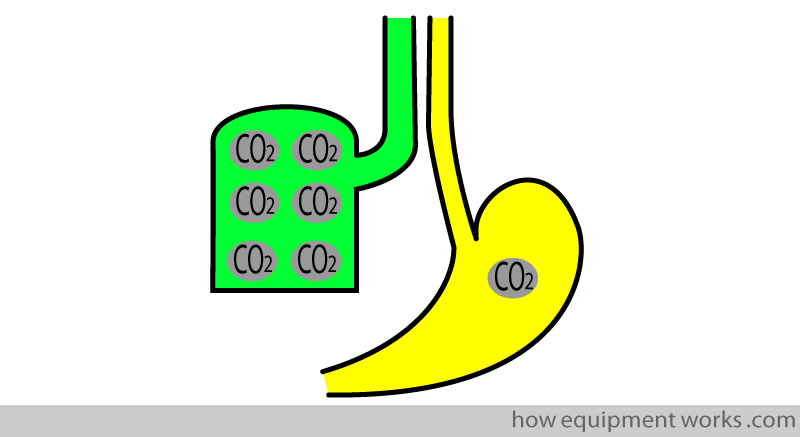
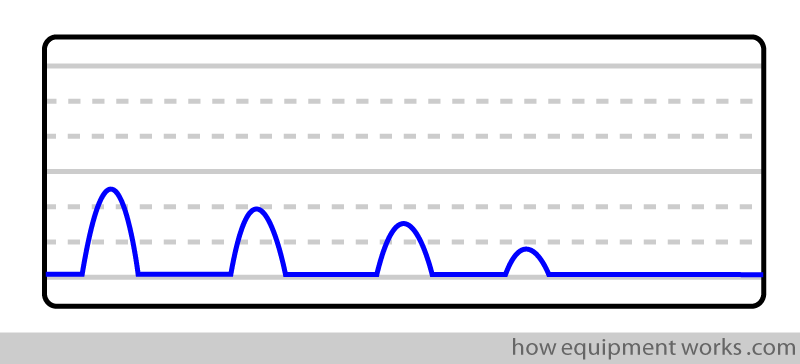
If the tracheal tube is in the oesophagus, there will be no or little CO2. You may either see a flat trace or a rapidly descending series of curves.
Other measurement techniques
The method described so far for CO2 measurement is the most commonly used method. There are other methods in use as well. However, these are not as commonly used and will not be described in much detail. These other methods are:
Raman Spectrography: This technique uses a laser to shine a light beam at the sample of CO2. The sample changes the wavelength of some of the light beams and these changes are used to measure the CO2.
Photo Acoustic Spectrography: The CO2 sample is bombarded with pulses of infrared waves. This makes the CO2 sample rapidly expand and contract, producing sound waves. A sensitive microphone picks up these sound waves, which vary according to how much CO2 is present in the sample.
Mass Spectrography: A very bulky device that measures the charge-to-mass relationship of the measured substance. It is not commonly used.
Well, that is it for this session on capnography. Hope you enjoyed it and learnt something. See you soon in another session ……. Bye!

Hello! My name is Pras and I am the author of this website that you are now reading. I have made this website completely free to access so that people from all over the world can benefit from it.
If you can afford it, I would be very grateful if you would consider making a single donation of one dollar (or the equivalent in your currency) to help cover the expenses needed to run this website (e.g. for special software and computers). For this website to survive, donations are desperately needed. Sadly, without donations, this website may have to be closed down.
Unfortunately, perhaps because many people think that someone else will donate, this website gets only very few donations. If you are able to, please consider making a single donation equivalent to one dollar. With support from people like you, I am sure that this educational website will continue to survive and grow.

