
We will discuss the following aspects. Please scroll down and start reading.
- Introduction to sound and ultrasound
- Sending and receiving ultrasound
- Interaction of ultrasound with body tissues
- Scanning modes: A scan
- Scanning modes: B scan
- Frequency, Wavelength, Resolution, and Depth
- Doppler Effect
Sound and Ultrasound
We are all familiar with sound. It helps us to communicate and listen to gossip. Audible alarms warn us and pulse oximeters sing saturations to us.
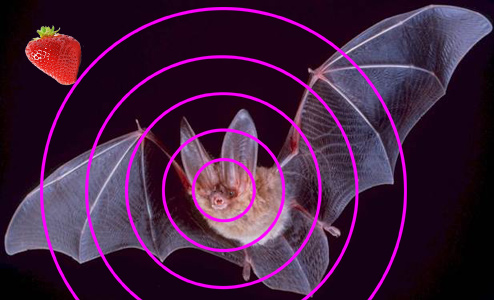
But most amazing is that sound can actually help us to see what is hidden, just like the way bats ‘see’.
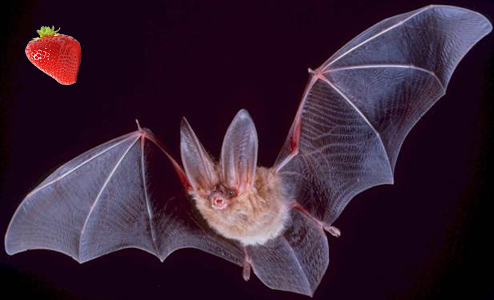
Unfortunately, bats always have the night shift. They go hunting for things to eat at night when food isn’t well-lit. A juicy red strawberry would not be easy to spot at night.
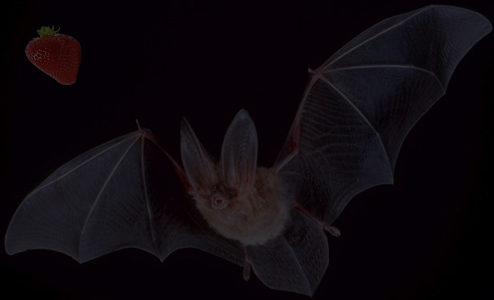
Fortunately, bats are gifted with a system of locating things with sound. First, they emit sound.
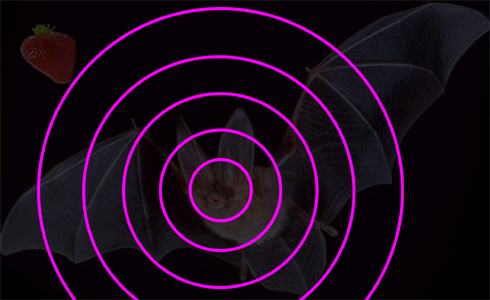
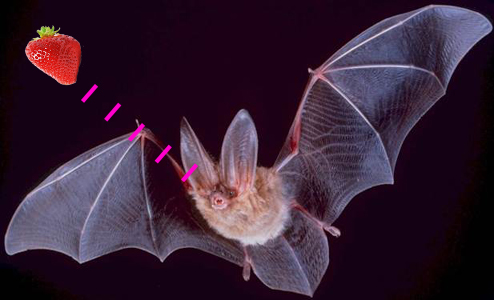
The sound waves bounce on objects such as the strawberry. The sound waves that bounce on the strawberry reflect back to the bat. The direction from where the sound returns tells it in which direction the strawberry is. The time taken for the sound waves to reach the strawberry and return back to the bat’s ear tells it how far the strawberry is. The longer the sound waves take to return, the further away the strawberry.
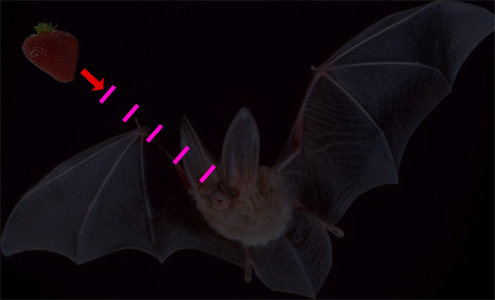
So using sound, the bat can find the unseen. In a similar way, we in anaesthesia can also use sound to locate the unseen. For example, we can use it to guide our needle when inserting a central venous catheter into the internal jugular vein in the neck of a patient without damaging other vital structures.

What is “sound” and “ultrasound “?
Sound is a vibration that is transmitted in a medium (e.g. air), that can be heard by a human ear. If you were an ant or a bird, the meaning of sound would be different. Sound specifically refers to what the human ear can hear.
All vibrations, including sound, have a frequency. Frequency is a measure of how often something “vibrates “ per second. The unit of frequency is Hertz, the official symbol being Hz, and can be thought of as “vibrations per second “ (this is not the official definition!). The human ear can hear between frequencies of about 20 Hz to 20,000 Hz. So “sound “ is vibrations in this frequency range.
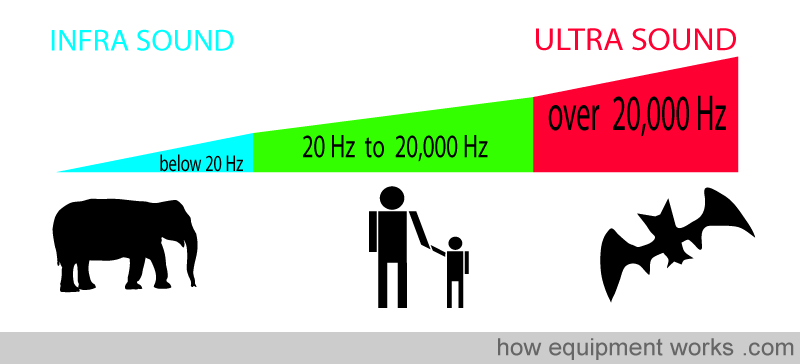
The human ear cannot hear below 20 Hz and frequencies below this are called “infrasound”. Elephants can use infrasound and use it to communicate jokes that they don’t want humans to hear.
The human ear cannot hear above 20,000 Hz. Frequencies above 20,000 Hz are called “ultrasound “. Bats use ultrasound to locate food as described above and dolphins use it to communicate with their friends. And importantly, ultrasound is used in anaesthesia for imaging various parts of the body. Ultrasound used in medical imaging typically operates at frequencies way above human hearing: about 2 million Hz to 20 million Hz (2-20 MHz).
Generation of Ultrasound Waves
To use ultrasound to find things, we first need to have a way of generating them. We need something to create vibrations that will travel in the tissues in a patient.
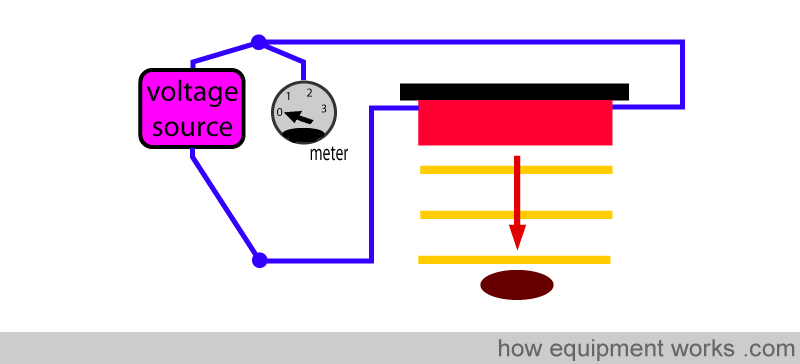
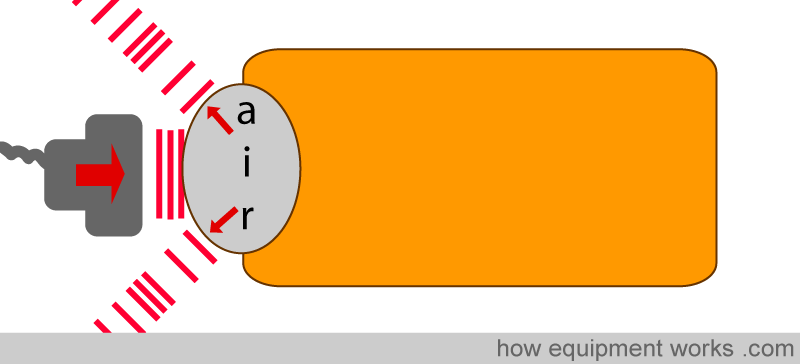
There is a special material called a “piezoelectric crystal”. This material has a very special property. When a voltage is applied to a piezoelectric crystal (shown in red below), it expands. When the voltage is removed, it contracts back into its original thickness.
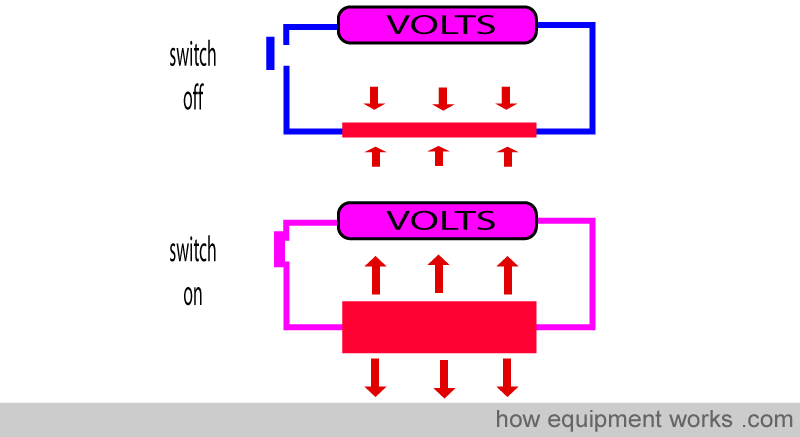
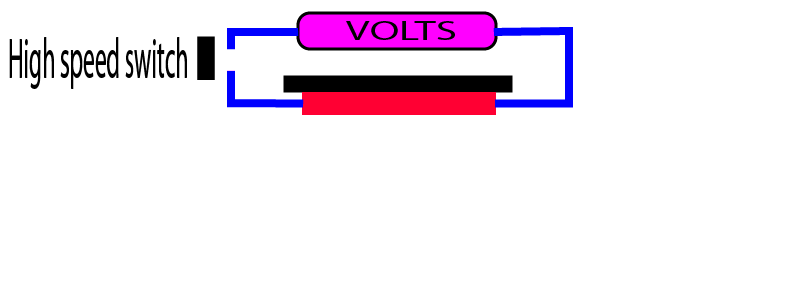
If the voltage is rapidly applied and removed repeatedly, the piezoelectric crystal rapidly expands and relaxes, creating ultrasound waves.
Receiving Ultrasound
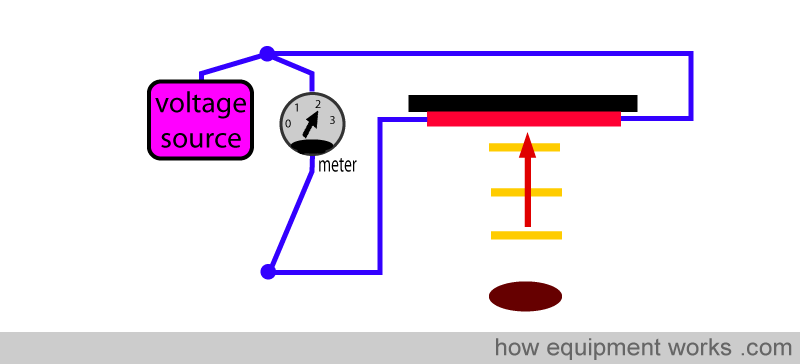
To locate something using ultrasound, one needs to have a way of listening to the sound waves that are bounced off various objects. In the previous section, we discussed how a piezoelectric crystal expands when a voltage is applied to it and how that is used to generate ultrasound waves. In addition to this, piezoelectric crystals have another very useful property that enables it to be also used for receiving ultrasound waves. When a piezoelectric crystal is compressed, it generates a voltage. This property is used to “listen “ for the ultrasound waves that return after striking objects. When returning sound waves hit the piezoelectric crystal, it gets compressed. The crystal then generates a voltage that corresponds to the intensity of the ultrasound wave that hits it.
The ultrasound machine conveniently uses the same piezoelectric crystal to transmit and listen to ultrasound waves. First, the machine applies a voltage to the crystal to expand it and this makes it transmit an ultrasound wave.
The ultrasound machine then very quickly switches to a listening mode by monitoring the voltage across the piezo-electric crystal. This transmit and receive cycle is repeated very rapidly.
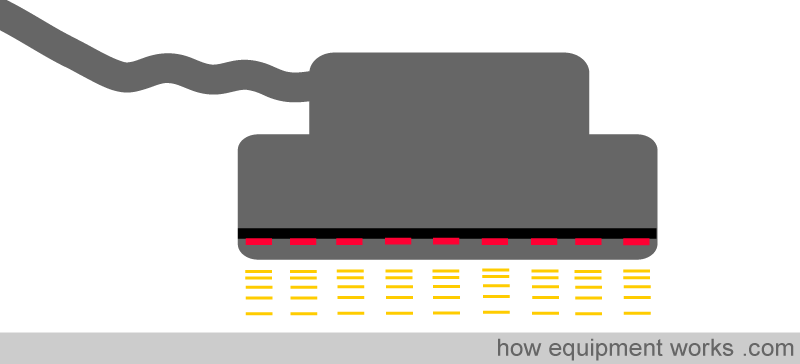
The above examples show only one crystal for clarity. In reality, ultrasound probes are composed of a large number of individual piezo-electric crystals. The information gathered from the crystals is processed by a computer to display the images on a screen.
Jelly
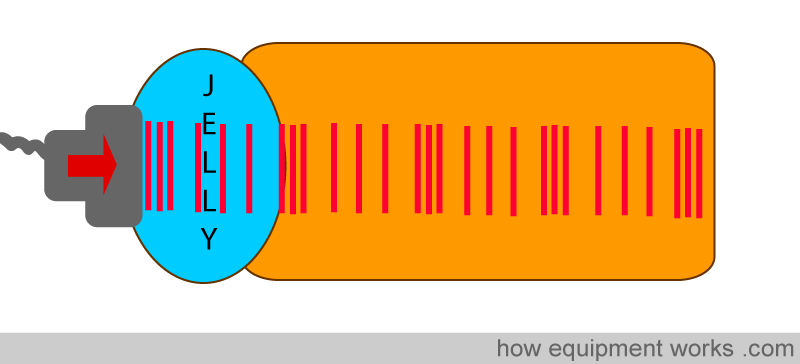
Air is the enemy of ultrasound. Ultrasound waves tend to reflect strongly wherever air meets biological tissue. If there is even a small bubble between the probe and the patient’s skin, the ultrasound waves will be reflected away instead of penetrating the skin. Without the waves going into the patient, you will not be able to get a decent image. Therefore, it is absolutely vital to make sure that there are no air bubbles between the probe and the skin of the patient.
On the other hand, ultrasound travels very easily through liquids. For this reason, it is common to use a thick liquid ( jelly ) between the probe and the patient’s skin. The thick liquid helps to keep away air bubbles and allows easy passage of the ultrasound waves.

Do you work in the anaesthetic team? If you do, please visit the free website below, which has anaesthesia-related fun and safety material. Click the button below to visit.

What happens to the ultrasound waves?
Once the ultrasound enters the body, different things can happen to them. Only some of it returns back to the probe to help the machine form an image. The rest is lost. When ultrasound enters the body, some of it undergoes:
1. attenuation
2. refraction
3. reflection
Attenuation
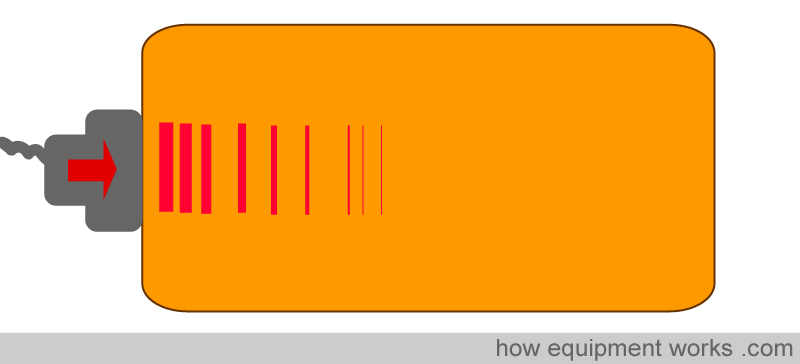
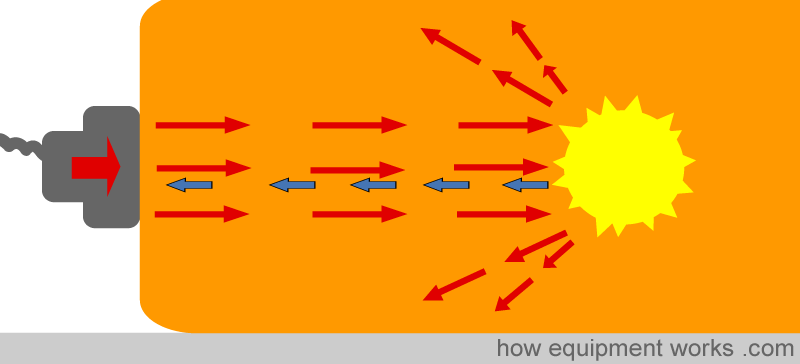
Some of the ultrasound waves are attenuated. That is, the body absorbs the ultrasound energy, making the waves disappear. These waves don’t return to the probe and are therefore “wasted”. The more the body tissues that the ultrasound waves have to cross, the more attenuation the waves suffer. That is one reason why it is more difficult to image deeper structures.
Refraction
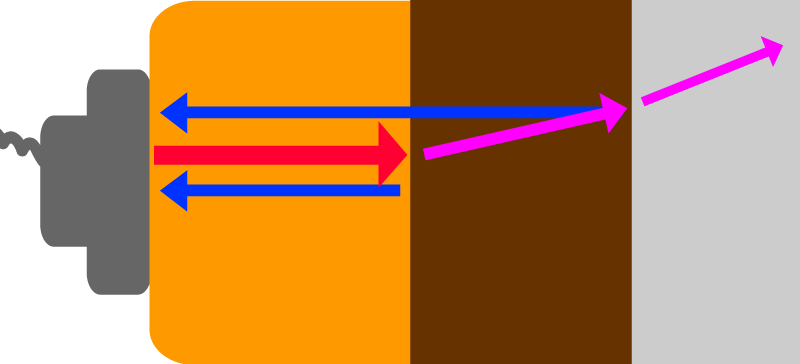
Every substance, such as nerves, muscles, or fat, has a unique property called “acoustic impedance”. Acoustic impedance is a somewhat complicated concept but basically depends on the density of the substance and the speed of ultrasound in that substance. Substances with different acoustic impedances alter the course of ultrasound waves in an important manner.
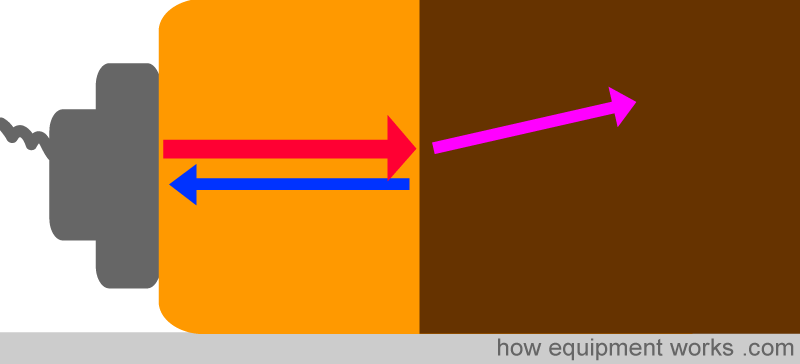
When an ultrasound wave (shown as a red arrow in the image below) tries to pass from one substance to another substance with a different acoustic impedance, two things happen to it.
Part of the ultrasound waves continues into the second substance but becomes slightly bent away from their original direction (pink arrow). The bending away when ultrasound passes from one substance to another substance with a different acoustic impedance is called refraction.
In addition to this, another very important thing happens. Part of the wave (shown as a blue arrow in the image below) is reflected back to the probe. The amount reflected back depends on the difference of the acoustic impedance between the two substances, the more the difference, the more the reflection. Reflected waves are extremely important since it is only these waves that return back to the probe and provide information for the machine to show an image.
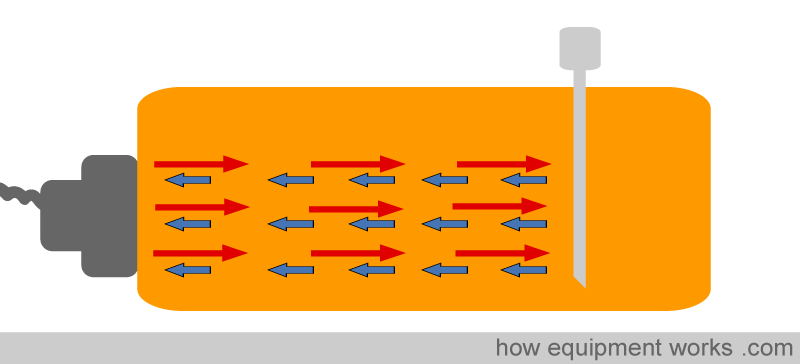
As the ultrasound wave crosses from one tissue to the next, each with a different acoustic impedance, some of the wave is reflected back at each crossing (two blue arrows in the image below). Therefore, multiple reflected waves return to the probe and the machine uses this information to display an image showing the different tissues.
Reflection
Irregular surfaced objects such as nerves scatter the ultrasound waves in all directions. A small portion of the waves are reflected back to the probe (shown as blue arrows in the image below). This is called “scattered reflection”.
If an object is large and smooth like a nerve-block needle, all the ultrasound wave is reflected back. This is very useful since it helps us to clearly see needles when performing ultrasound-guided nerve blocks. This mirror-like reflection, where the waves are reflected back mostly in one direction is officially called “specular reflection”.
Ultrasound Scanning Modes
When we look at things with our eyes, there are various ways in which we “look “. At times, we might choose to look only straight ahead like when we read a notice on a wall.

Or we might look horizontally when scanning the sea.

Or we might scan the whole area, up and down, left and right, in many dimensions when absorbing scenery such as the one below in Sri Lanka.

In a similar way, there are many different ways an ultrasound probe can “look “ at things. These ways are called “modes “ and these will be described below. The modes are named with letters and may sound very confusing. However, we will discuss each in turn and you will, at the end, understand the basics of them.
A mode (Amplitude mode)
B mode (Brightness mode) including real-time, 2 dimensional, B mode
M mode (Motion mode)
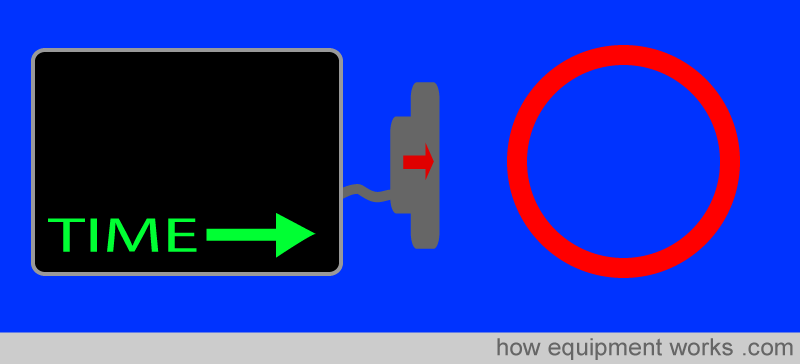
A Mode Scanning
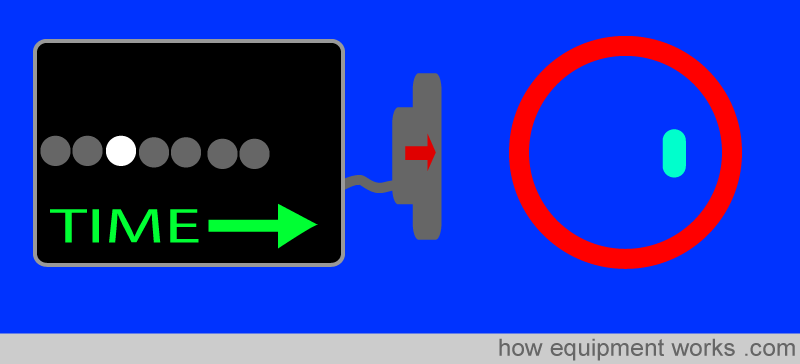
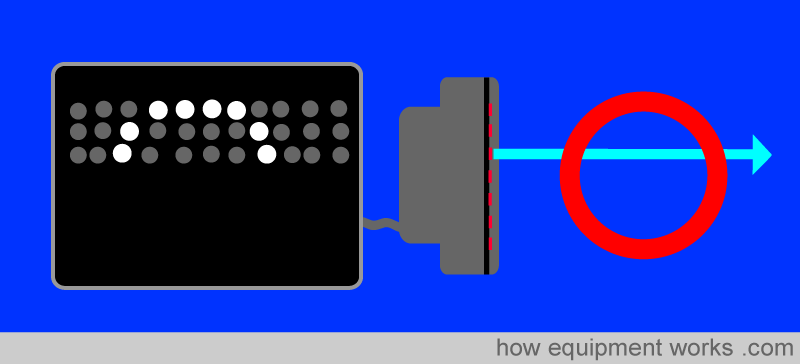
The A mode is the simplest form of ultrasound imaging and is not frequently used. The ultrasound wave that comes out of the probe travels in a narrow pencil-like straight path.

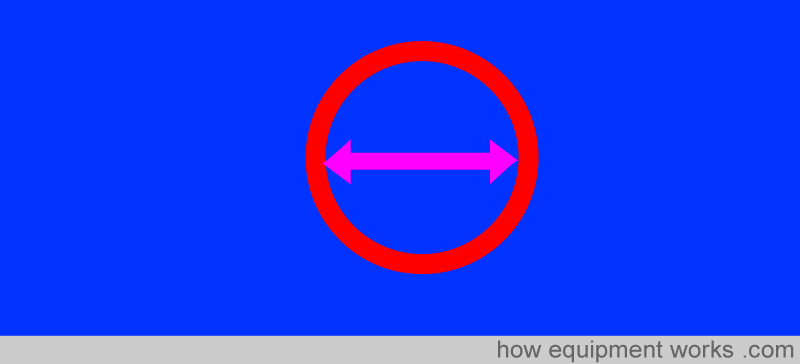
One use of the A scan is to measure length. For example, ophthalmologists can use it to measure the diameter of the eyeball. Imagine that the red circle below is the eyeball and you want to measure the diameter of it.
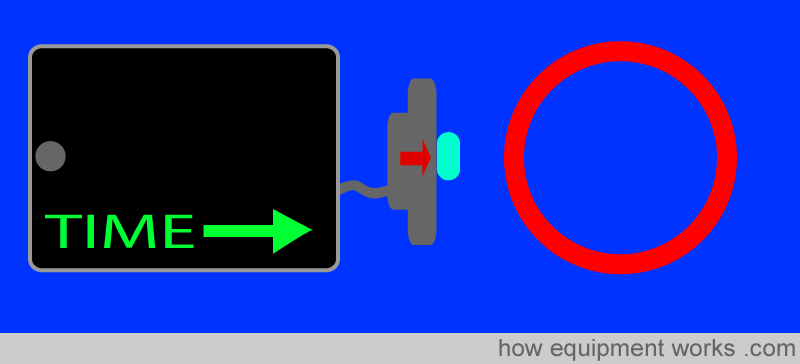
An ultrasound machine scanning in “A scan” mode can be used. The probe is placed on one end of the eyeball.
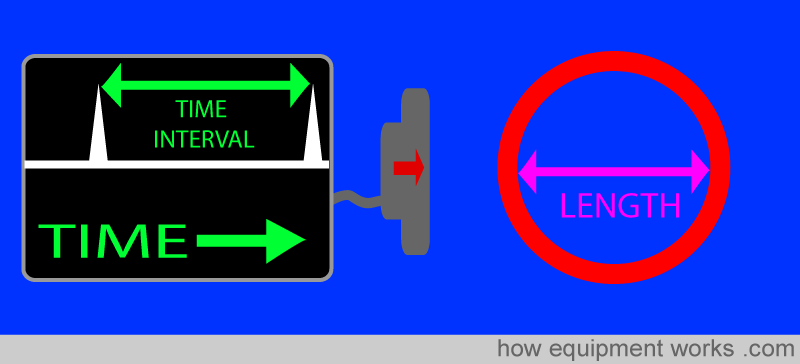
An ultrasound wave is sent from the probe and at the same instance, a line from the left of the screen starts to be drawn. This line moves horizontally measuring time.
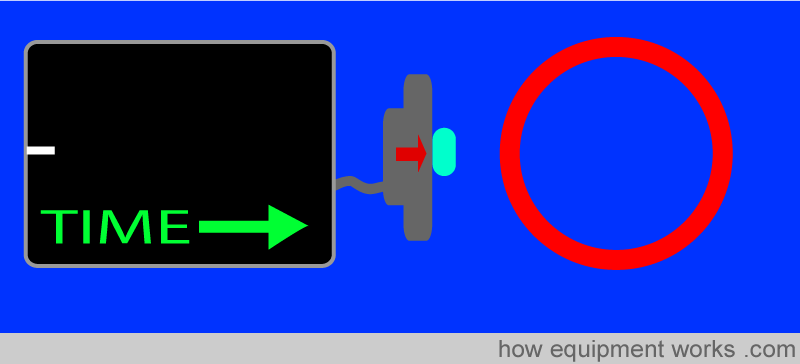
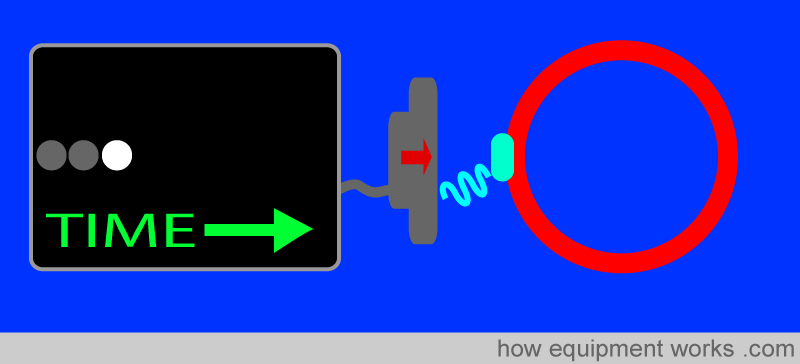
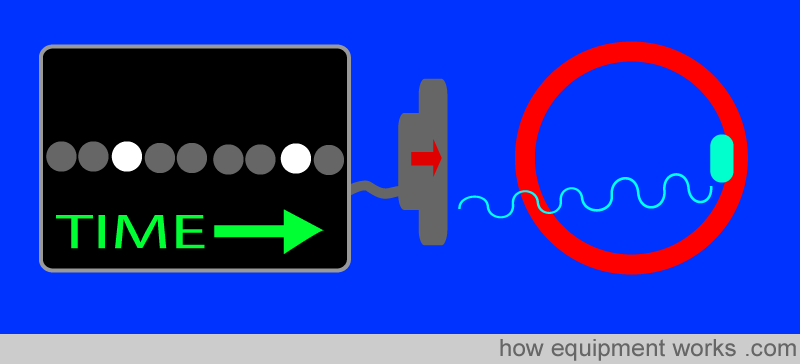
As the wave reaches the first wall of the eye, some of the ultrasound is reflected back into the probe. The returned wave is recorded on the line as a bump. The stronger is the returned wave, the higher the height of the bump. The height of the bump is called Amplitude which is what the “A” of “A scan” stands for.
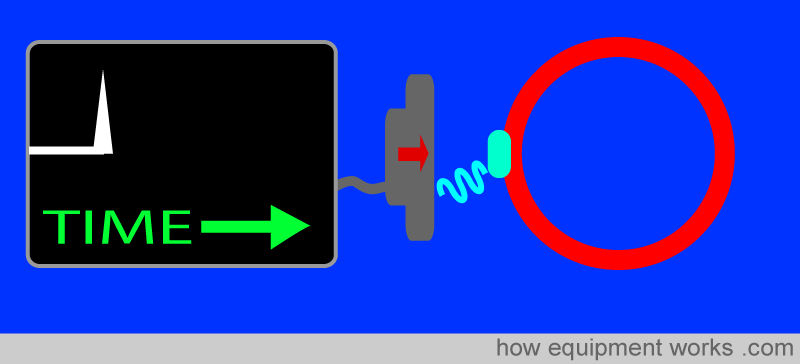
The ultrasound wave continues further in the eye.
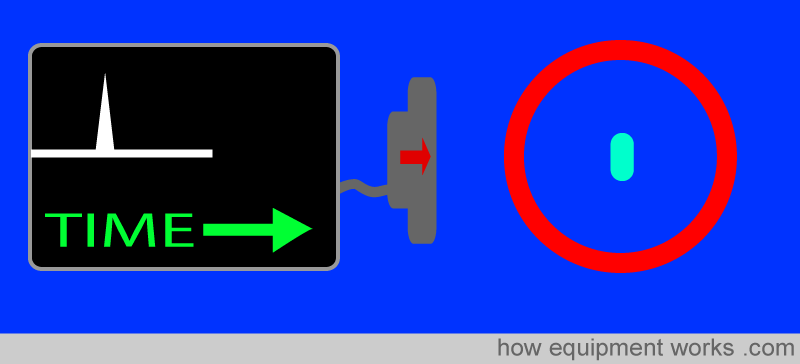
The wave then meets the wall that is furthest away. Again some of the ultrasound wave is reflected back into the probe and another bump is drawn.
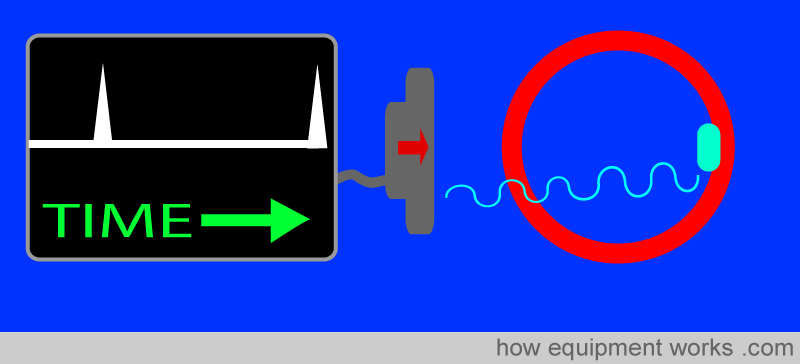
The time difference between the first bump and the second bump represents how long the ultrasound wave took to travel between the two walls. The longer the length, the longer is the time difference. The speed of ultrasound in the eye is known to be 1500 meters per second (yes, that is fast). So if you know the time difference (given by the interval between the two bumps), you can calculate how far the wave travelled between the two walls of the eye, giving you the eyeball length.
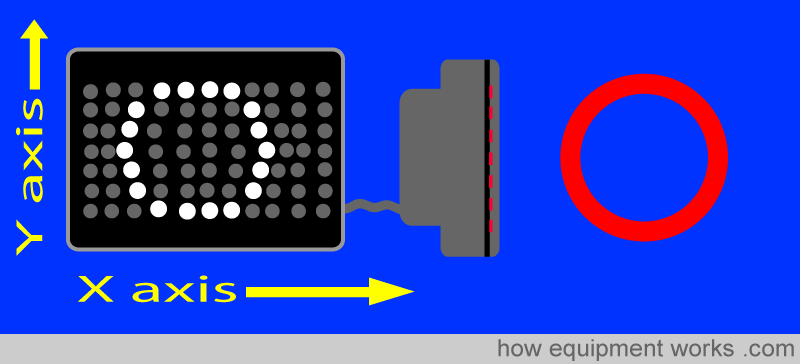
B Mode Scanning
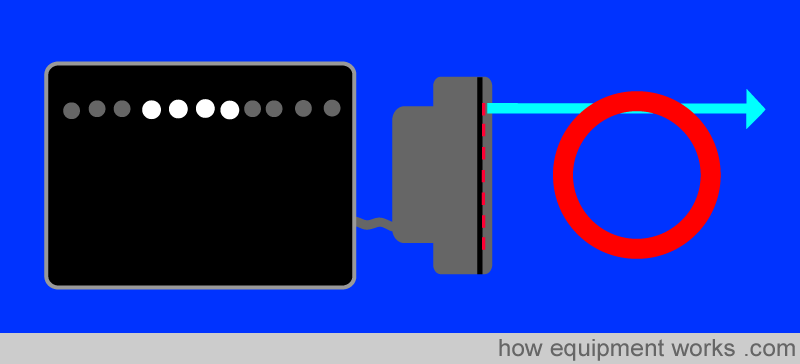
In its simplest form, the B-scan mode is very similar to the A-scan mode. Just like the A-scan, a wave of ultrasound is sent out in a pencil-like narrow path. And again like the A scan, the horizontal line represents the time since the wave was released.
Again using the eyeball as an example, the probe is placed on one end. Like in the A-scan, when the wave meets the first wall, a part of the wave is reflected back into the probe. However, this time, instead of a bump, the strength of the returning wave is recorded by a bright dot. The brightness of the dot represents the strength of the returning wave. The brighter the dot, the stronger is the returning wave. The letter “B” of “B scan” represents Brightness.
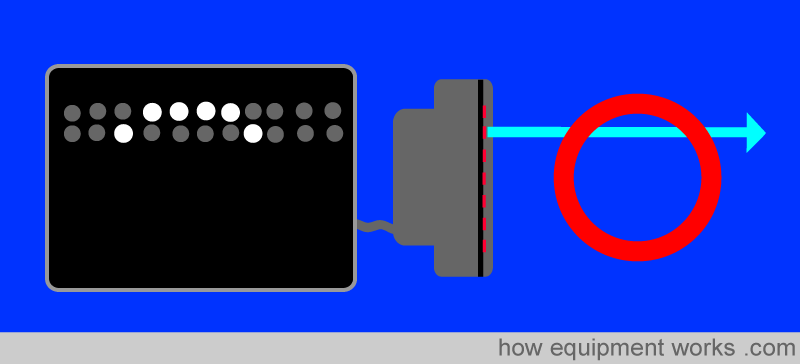
The wave continues.
And when the wave reaches the other wall, again part of it is reflected back into the probe. This returning wave, like the returning wave from the previous wall, is represented as a bright dot on the screen.
The B scan in the form discussed doesn’t amount to much …. just a few dots of different brightness along a line. However, if a B scan is done at different levels of the object, you will get a two-dimensional image on the screen as shown below. First, a B scan is done at the top of the structure chosen, e.g. the eye.
The first B scan line is kept on the screen. Then at a slightly different level, the B scan is repeated.
This B scan result is also kept on the screen. Then, again at a slightly different level, the B scan is repeated.
In this way, a two-dimensional (2D) image of the object is formed on the screen.

In real life, the process happens very quickly. The structures are scanned and the image is redrawn many times a second.
Since the image is redrawn so rapidly, one can see size changes (e.g. pulsations of the carotid artery) in “real-time” (i.e. as it happens) . The B scan is the most common mode of ultrasound that we see in anaesthesia. The complete description of the mode is “real-time, 2 dimensional (2 D), B scan”. The 2 dimensional (2D) refers to the fact that the image has two dimensions; horizontal (X axis) and vertical ( Y axis).
M Mode Scanning
This mode is mostly used in cardiology and will not be described.
Please click the “Next” button below to read part 2 about how ultrasound imaging works. Thank you.