Note: This is part 2 of the discussion of how ultrasound imaging works. If you have not read part 1, please click here to go to part 1.
Frequency, Wavelength, Resolution, and Depth
Frequency, wavelength, resolution, and depth are interlinked. These seem to be complex physics stuff to grasp, but it is worth understanding them because it can help you to get the best images from your ultrasound machine. This website will simply it all for you so don’t worry.
The first step is to understand what the terms mean. Each of the terms will be described to you, starting with “frequency”.
Frequency
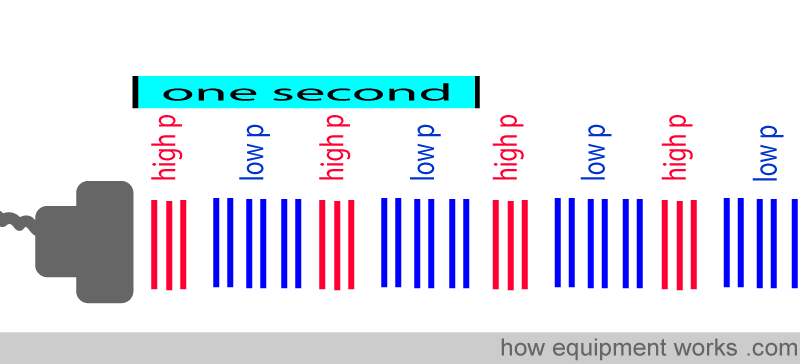
As you may recall, ultrasound waves are created by a vibrating piezoelectric crystal. The vibration creates alternate high-pressure and low-pressure areas which travel forward.
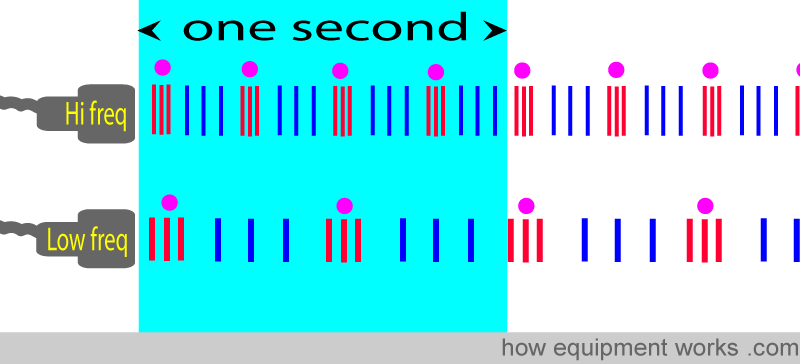
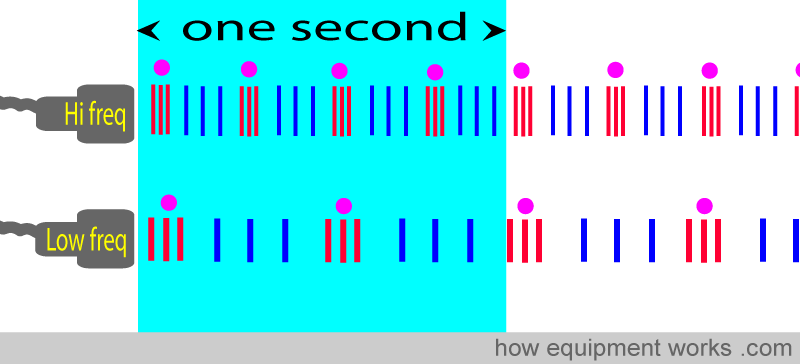
Frequency is the number of high-pressure/low-pressure cycles in a period of one second.
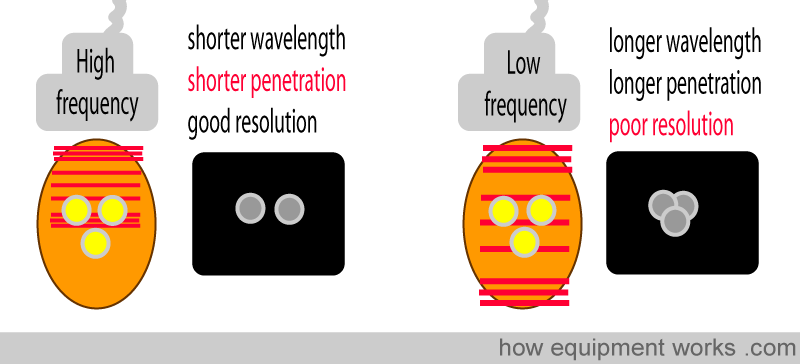
In the image below, the high-frequency wave has a higher number of cycles of high /low-pressure areas in a period of one second. Similarly, the low-frequency wave has a lower number of cycles of high/low areas of pressure per second.
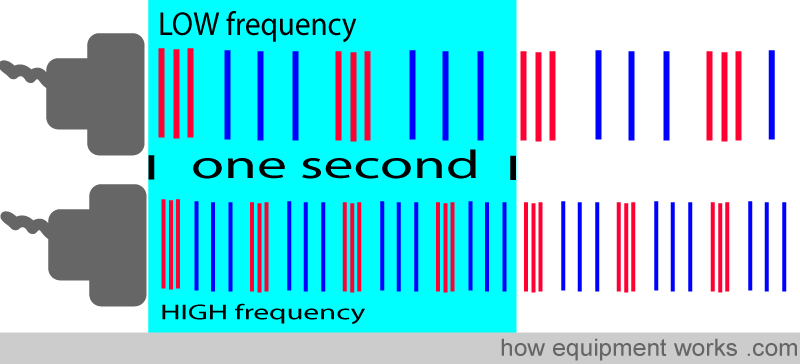
The unit of frequency is Hertz, which is abbreviated to Hz. Hz refers to the “number of cycles per second”. In the image below, the low frequency has 2 high /low-pressure cycles per second. In other words, the low-frequency wave below has a frequency of 2 Hz. Similarly, the high-frequency wave below has 4 high-pressure/low-pressure cycles per second. In other words, the high-frequency wave below has a frequency of 4 Hz. These small numbers have been used only to explain the concept of frequency to you. In reality, ultrasound operates at many million cycles per second. (e.g. about 2 million Hz to 20 million Hz (2-20 MHz)

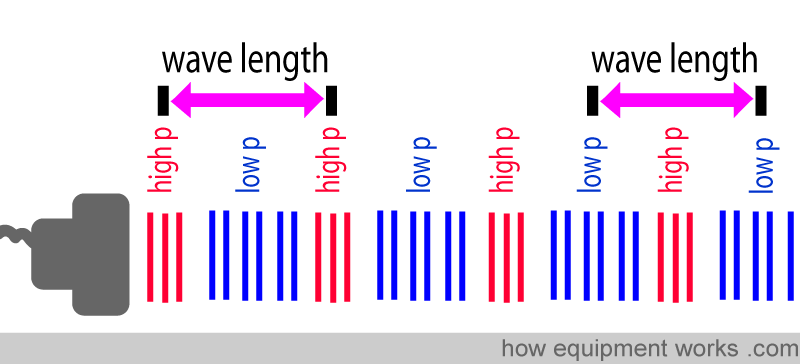
Wavelength
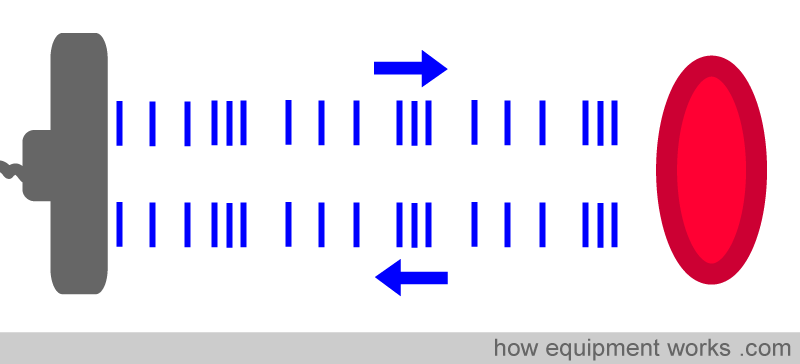
Wavelength is the distance between identical points in adjacent cycles of a waveform. For example, you can measure wavelength by measuring the distance between two adjacent highest pressure points in the wave.
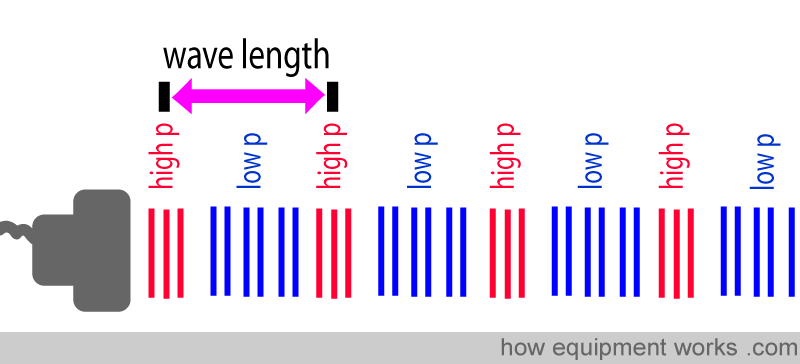
Similarly, you could have measured the distance between two adjacent lowest pressure points to get the wavelength.
In either case, the wavelength is the same for a given wave.
Relationship between Wavelength & Frequency
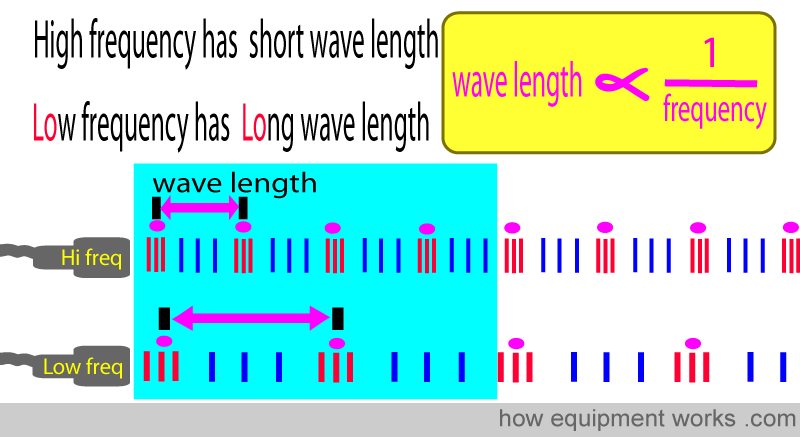
Wavelength and frequency are importantly interrelated. When the frequency is increased the wavelength becomes shorter. Similarly, when the frequency is decreased, the wavelength becomes longer. This has some important implications when you use ultrasound in clinical practice and this will be explained to you later.
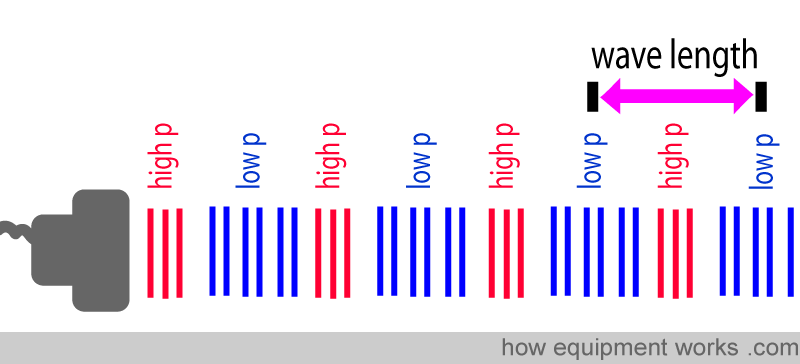
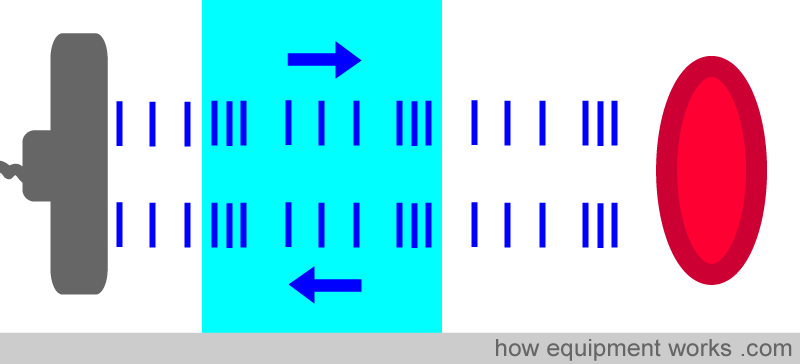
First, let us discover why high-frequency waves have a shorter wavelength. In the following image, the upper wave has a higher frequency. You will recall that high frequency means higher cycles per second (one cycle = one high-pressure area followed by one low-pressure area). In this example, the high-frequency wave has four cycles per second (the high-pressure areas are shown with a purple dot). Similarly, the lower wave has a lower frequency and therefore has fewer cycles per second.
This means that the high-frequency wave has more cycles that are “squeezed” into the one-second time frame. The low-frequency wave has fewer cycles “squeezed” into the same one-second time frame. Thus the cycles in a low-frequency wave are more more wide apart. As discussed before, wavelength can be measured between two adjacent high-pressure areas of a wave. You can now see that low-frequency waves have a longer wavelength. High-frequency waves have a shorter wavelength.
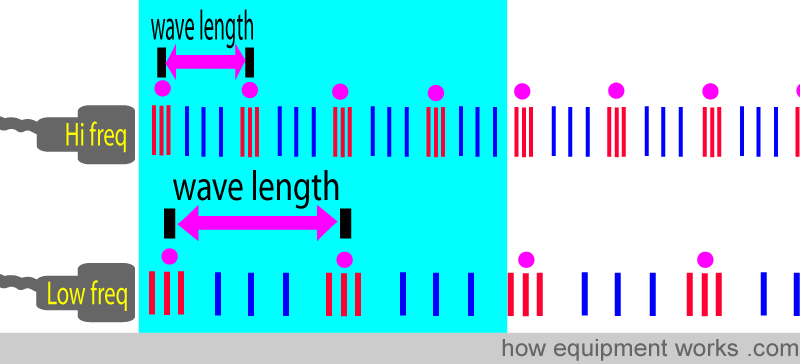
In more “serious” physics terms, one would describe this as “wavelength is inversely proportional to frequency”. This can be expressed as the equation shown in the yellow square below:

Resolution
We have discussed frequency and wavelength. These can affect “resolution”. So let us understand what resolution means.
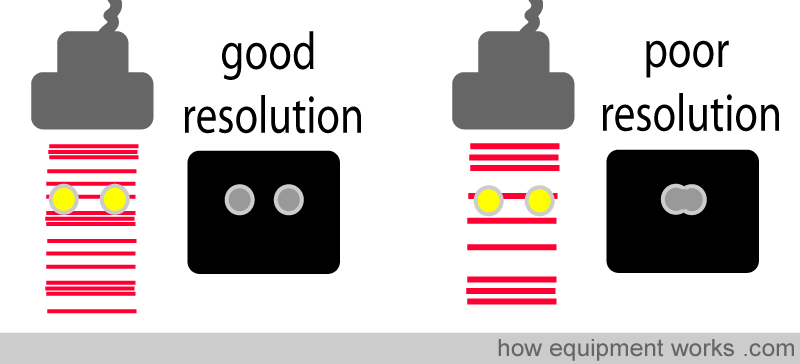
Resolution is the ability to see two things as two things.
If the resolution is good, the picture will be clear and the two objects will look like two objects.
If the resolution is poor, the picture will be blurred and the two objects will look like one.
Our aim is to get the best possible resolution from our ultrasound machine. The higher the resolution, the higher the quality of the image we see.
For slightly complex physics reasons, shorter wavelengths give a better resolution.
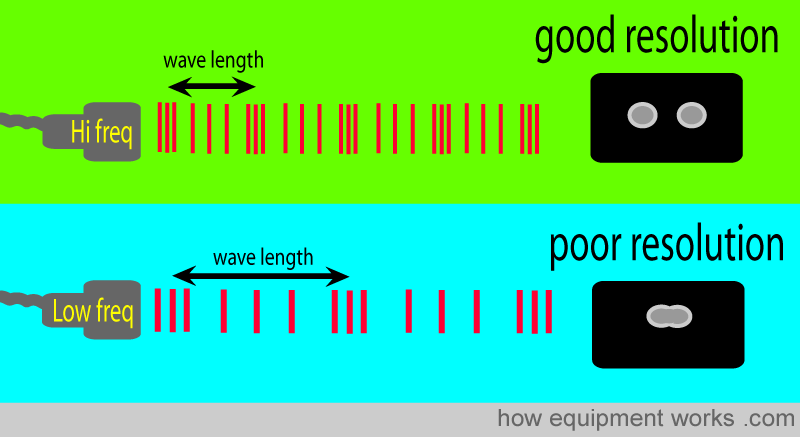
But we also know that wavelength and frequency are related to each other. To get a shorter wavelength we should use a high frequency.
So to get a good resolution, we should use a high frequency because a high frequency has a short wavelength.
i.e. high frequency = short wavelength = good resolution


Do you work in the anaesthetic team? If you do, please visit the free website below, which has anaesthesia-related fun and safety material. Click the button below to visit.

Depth
If the ultrasound waves do not penetrate the body to a sufficient depth, you may miss seeing the structure that you want to see.
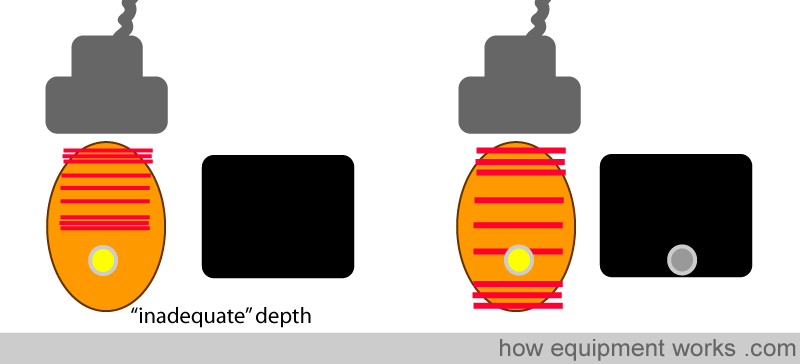
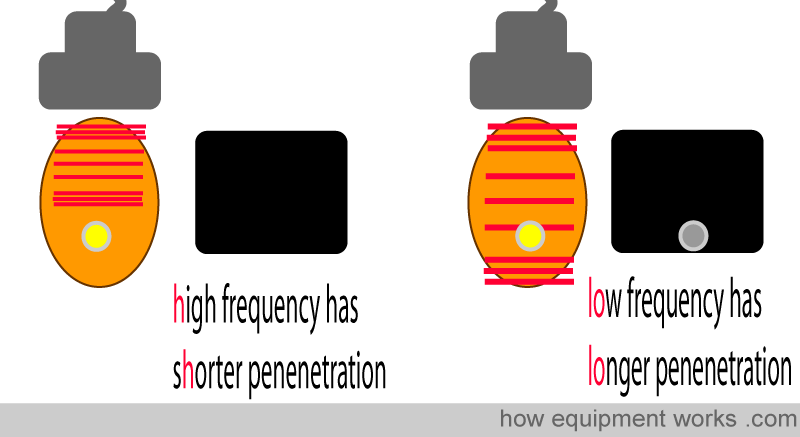
The depth of penetration is related to the frequency of the ultrasound wave. Higher frequencies have a shorter depth of penetration. Lower frequencies have a longer depth of penetration.
So in clinical practice, you might think that using the lowest frequency is the best because it gives a longer depth of penetration. However, it isn’t as straightforward as the next section will explain.
Finally linking it all: Frequency, Wavelength, Resolution, and Depth
Now that you have persisted in understanding frequency, wavelength, resolution and depth, let us try and combine them in a meaningful way.
For ultrasound to be clinically useful, we want sharp pictures. I.e. we want the best resolution.
Additionally, we want adequate depth of penetration to see deeper structures.
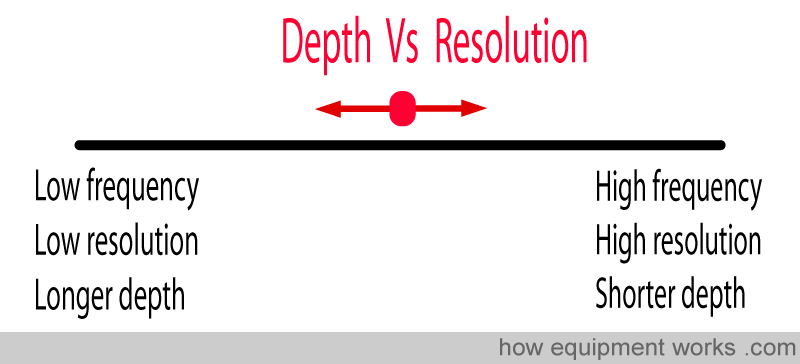
The physics of ultrasound is such that both these requirements cannot be fully met at the same time. For a good resolution, we need a short wavelength, which means we need a higher frequency. Unfortunately, a higher frequency also means a shorter penetration.
So when choosing the optimum frequency, we have to choose somewhere between the needs of a good depth of penetration and a good resolution.
If the frequency is too high, the depth of penetration of the ultrasound will be inadequate and you may not see the structure you want.
If the frequency is too low the ultrasound waves will penetrate deeper than necessary. The unnecessarily low frequency will give you a low-resolution image that will be blurred.

The optimum frequency is one that will give you just the adequate amount of depth necessary to see the structures of interest. You don’t allow unnecessary depth which would have unnecessarily lowered the frequency.
To summarise:
Correct depth = reasonable high frequency = reasonably short wavelength = reasonably good resolution.
Too much depth = low frequency = long wavelength = poor resolution
Too little depth = won’t see structures of interest!
Doppler Effect
Before proceeding to explain the Doppler effect, let us quickly revise what frequency means. Frequency is the number of oscillations of the sound wave that occur per second. In the example below, the high frequency has four oscillations per second and the low frequency has two oscillations per second.
Now let me try and explain the Doppler effect. As you will recall, the ultrasound machine measures the distance to things by transmitting ultrasound waves from the probe and seeing how long the wave takes to return back to the probe.
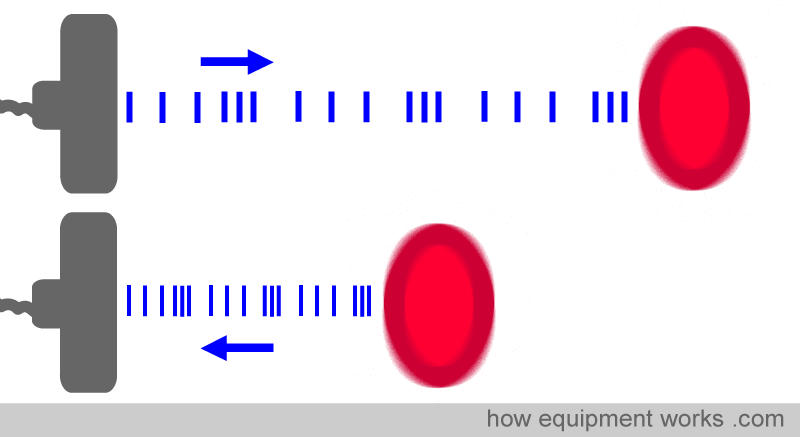
The transmitted wave has a certain frequency. The wave that returns to the probe also has a certain frequency. When the wave is bounced back from a stationary object such as a nerve, both the transmitted and the returned waves have the same frequency.
However, if we repeat the same thing with an object moving towards the probe, something interesting happens. Imagine that the red disc below is a red blood cell moving towards the probe ( I know it is a rather large red blood cell !).
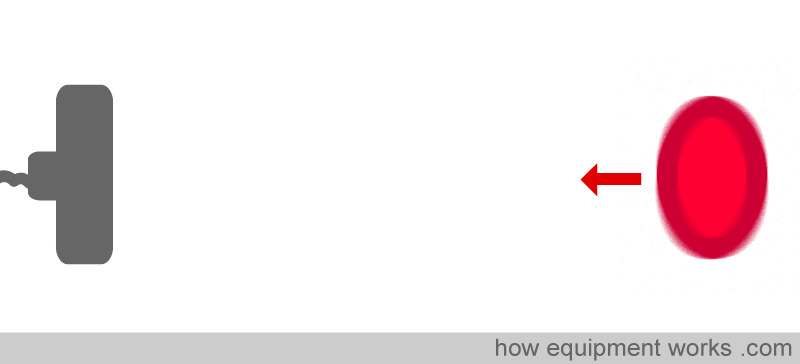
Again we send out an ultrasound wave.
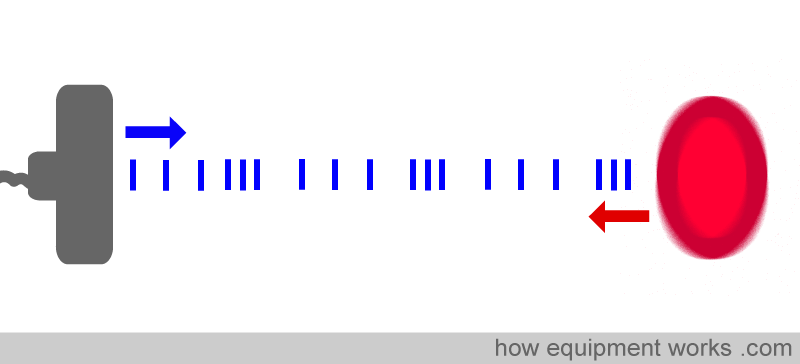
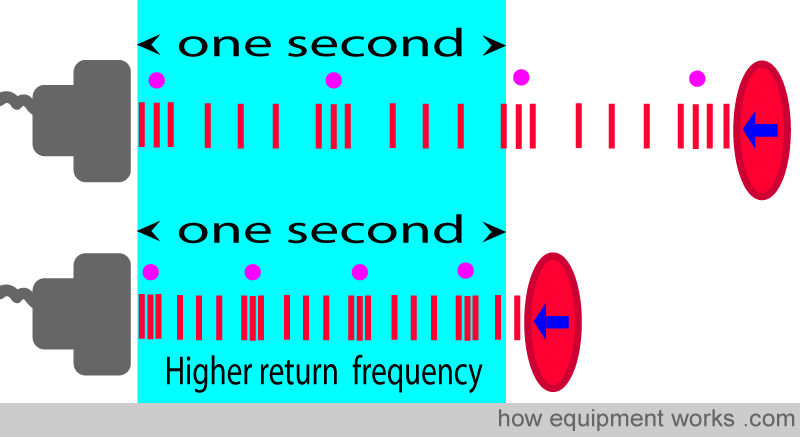
This ultrasound wave reaches the moving red blood cell and bounces back. However, this time if you measured the frequency of the returned wave, it will not be the same as the frequency of the transmitted wave. The wave that bounces off an object moving towards the probe will have a higher frequency than the frequency of the wave transmitted from the probe. This is because the moving object “squashes” the waves as it moves towards the probe (see diagram below). This is an example of the Doppler effect. When a wave is sent to an object that is moving towards the transmitting probe, the Doppler effect makes the frequency of the returning wave to be higher than the frequency of the wave sent out. The faster the object moves towards the transmitting probe, the higher will be the difference.
Ultrasound imaging devices can use the Doppler effect to help us in many ways, including helping us to identify blood vessels. When you scan structures without using the Doppler effect, the machine simply sees how long the waves take to return back to the probe and constructs an image.

However, this image does not clearly show which of the circles is a blood vessel and which is a nerve. Fortunately, blood vessels have one big difference from nerves. Blood vessels are full of rapidly moving red blood cells. When using an ultrasound machine with the ability to look for the Doppler effect, the machine constructs an image in the usual way by seeing how long waves take to return back to the probe. In addition, it also analyses the frequency of the returned waves. Whenever the returned wave has a frequency different to the frequency of the transmitted wave, the machine knows that the place where those waves bounced back from has moving objects. To help you see these areas of moving cells, the ultrasound machine “adds colour” to areas showing the “Doppler effect”. In the image below, this helps you to differentiate nerves from blood vessels. The nerve has no moving cells, so there is no Doppler effect and therefore no colour is added by the machine. The blood vessel has rapidly moving cells which cause a Doppler effect, and where this occurs, the machine adds the colour red to help you identify it. This makes it easy for you to identify the blood vessels.

Let me try and explain how the Doppler effect happens. When an ultrasound wave meets something moving towards it, the wave gets ‘compressed’ by the object.
The compression of the wave into a smaller length means that the oscillations of high and low-pressure areas of the wave become more concentrated. As the wave gets compressed, it has more oscillations (high-pressure/low-pressure areas) per second than before ( i.e. the frequency has increased). This explains how the frequency of waves reflected from objects moving towards the probe has a higher frequency than the frequency of the wave sent out.
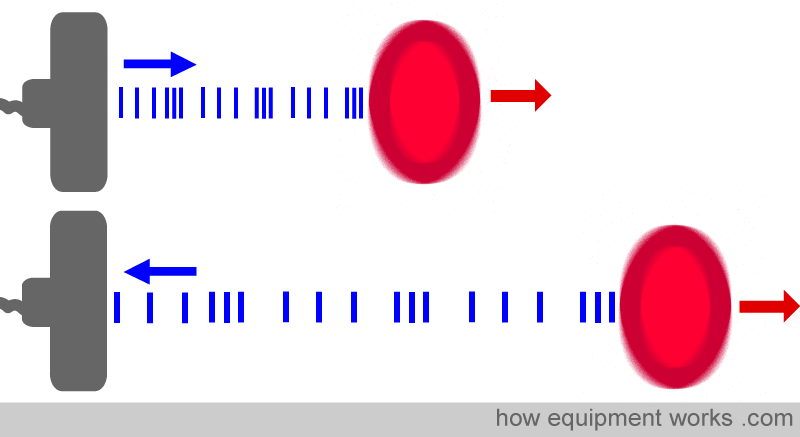
The Doppler effect also occurs for objects moving AWAY from the transmitting probe. Again there is a difference between the frequency of the transmitted waves and the frequency of the returning waves. However this time, the returning waves have a LOWER frequency than the frequency of the waves transmitted. The faster the object moves away, the greater will be the frequency difference. The reason for this decrease in frequency is the opposite of the explanation given before. In this case, the object moving away ‘stretches’ the wave. The stretching reduces the number of oscillations per second.
To summarise, the Doppler effect causes the frequency of waves reflected from a moving object to be different from the frequency of the wave sent out of the probe.
If the object is moving towards the probe, the reflected frequency is increased.
If the object is moving away, the reflected frequency is decreased.
Ultrasound machines tell us Doppler effect information using colour. It uses different colours to show the direction and speed of flow. This helps you to identify vessels.

We have now reached the end of our discussion on the basics of ultrasound physics. I hope it has given you a good introduction to the subject and will help you when you read further on this topic.
Bye and hope to see you soon in another section of the website.

Hello! My name is Pras, and I am the author of this website. I have made the website completely free to access so that people from all over the world can benefit from it.
If you can afford it, I would be very grateful if you would consider making a single donation of one dollar (or the equivalent in your currency) to help cover the expenses needed to run this website (e.g. for special software and computers). For this website to survive, donations are desperately needed. Sadly, without donations, this website may have to be closed down.
Unfortunately, perhaps because many people think that someone else will donate, this website gets only very few donations. If you are able to, please consider making a single donation equivalent to one dollar. With support from people like you, I am sure this educational website will continue to survive and grow. Thank you very much for your support.